

Trade-off between frequency and precision during stepping movements: Kinematic and BOLD brain activation patterns
- PMID: 26857613
- PMCID: PMC6867488
- DOI: 10.1002/hbm.23131
Trade-off between frequency and precision during stepping movements: Kinematic and BOLD brain activation patterns
Abstract
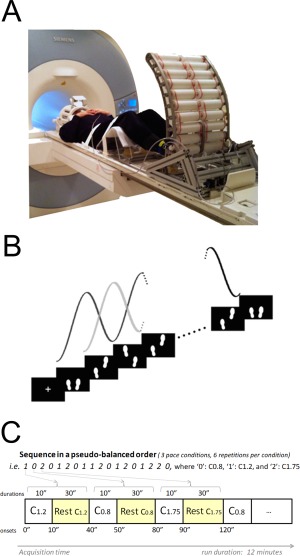
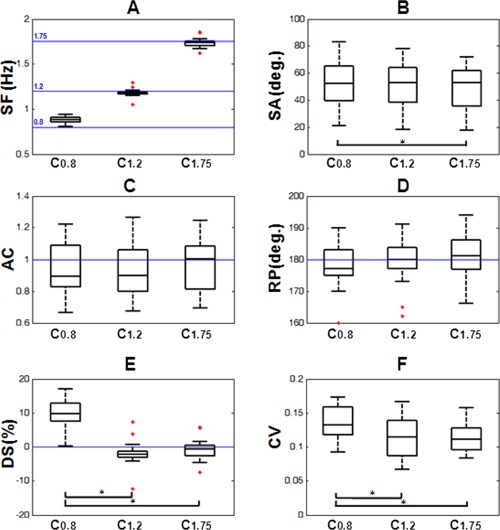
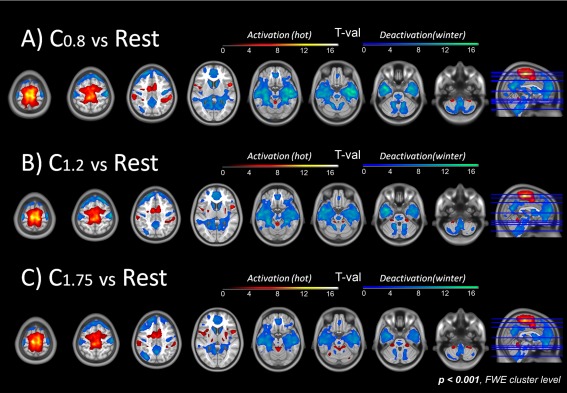
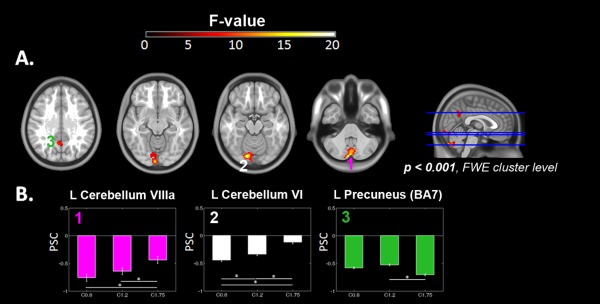
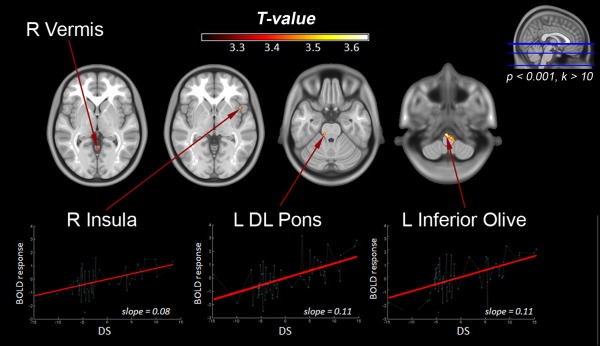
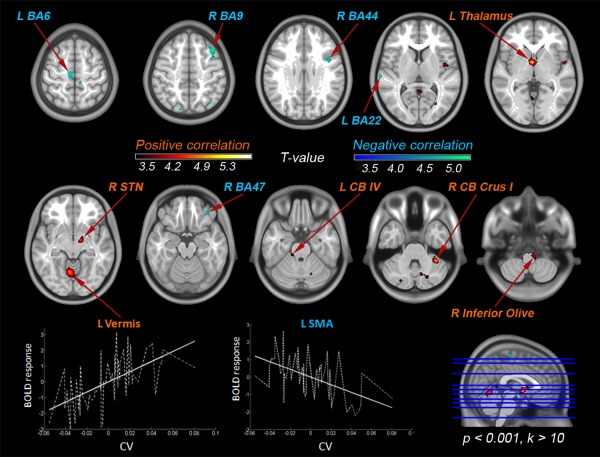
The central nervous system has the ability to adapt our locomotor pattern to produce a wide range of gait modalities and velocities. In reacting to external pacing stimuli, deviations from an individual preferred cadence provoke a concurrent decrease in accuracy that suggests the existence of a trade-off between frequency and precision; a compromise that could result from the specialization within the control centers of locomotion to ensure a stable transition and optimal adaptation to changing environment. Here, we explore the neural correlates of such adaptive mechanisms by visually guiding a group of healthy subjects to follow three comfortable stepping frequencies while simultaneously recording their BOLD responses and lower limb kinematics with the use of a custom-built treadmill device. In following the visual stimuli, subjects adopt a common pattern of symmetric and anti-phase movements across pace conditions. However, when increasing the stimulus frequency, an improvement in motor performance (precision and stability) was found, which suggests a change in the control mode from reactive to predictive schemes. Brain activity patterns showed similar BOLD responses across pace conditions though significant differences were observed in parietal and cerebellar regions. Neural correlates of stepping precision were found in the insula, cerebellum, dorsolateral pons and inferior olivary nucleus, whereas neural correlates of stepping stability were found in a distributed network, suggesting a transition in the control strategy across the stimulated range of frequencies: from unstable/reactive at lower paces (i.e., stepping stability managed by subcortical regions) to stable/predictive at higher paces (i.e., stability managed by cortical regions). Hum Brain Mapp 37:1722-1737, 2016. © 2016 Wiley Periodicals, Inc.
Keywords: effect of frequency; functional neuroimaging; kinematics; locomotion; lower limb movements; precision; predictive strategy; reactive strategy.
© 2016 Wiley Periodicals, Inc.
Figures
Similar articles
-
MRI-compatible device for examining brain activation related to stepping.IEEE Trans Med Imaging. 2014 May;33(5):1044-53. doi: 10.1109/TMI.2014.2301493. IEEE Trans Med Imaging. 2014. PMID: 24770910
-
Turning a cylindrical treadmill with feet: An MR-compatible device for assessment of the neural correlates of lower-limb movement.J Neurosci Methods. 2018 Sep 1;307:14-22. doi: 10.1016/j.jneumeth.2018.06.006. Epub 2018 Jun 18. J Neurosci Methods. 2018. PMID: 29924979
-
The neural control of bimanual movements in the elderly: Brain regions exhibiting age-related increases in activity, frequency-induced neural modulation, and task-specific compensatory recruitment.Hum Brain Mapp. 2010 Aug;31(8):1281-95. doi: 10.1002/hbm.20943. Hum Brain Mapp. 2010. PMID: 20082331 Free PMC article.
-
Decoding Internally and Externally Driven Movement Plans.J Neurosci. 2015 Oct 21;35(42):14160-71. doi: 10.1523/JNEUROSCI.0596-15.2015. J Neurosci. 2015. PMID: 26490857 Free PMC article.
-
Mental steps: Differential activation of internal pacemakers in motor imagery and in mental imitation of gait.Hum Brain Mapp. 2017 Oct;38(10):5195-5216. doi: 10.1002/hbm.23725. Epub 2017 Jul 21. Hum Brain Mapp. 2017. PMID: 28731517 Free PMC article.
Cited by
-
Resting-state functional connectivity of subcortical locomotor centers explains variance in walking capacity.Hum Brain Mapp. 2018 Dec;39(12):4831-4843. doi: 10.1002/hbm.24326. Epub 2018 Jul 27. Hum Brain Mapp. 2018. PMID: 30052301 Free PMC article.
-
Characterizing the supraspinal sensorimotor control of walking using MRI-compatible system: a systematic review.J Neuroeng Rehabil. 2024 Mar 5;21(1):34. doi: 10.1186/s12984-024-01323-y. J Neuroeng Rehabil. 2024. PMID: 38443983 Free PMC article.
-
The lateralized cerebellum: insights into motor, cognitive, and affective functioning across ages: a scoping review.J Neurol. 2025 Jan 15;272(2):122. doi: 10.1007/s00415-024-12884-2. J Neurol. 2025. PMID: 39812809
-
Retention, savings and interlimb transfer of reactive gait adaptations in humans following unexpected perturbations.Commun Biol. 2018 Dec 14;1:230. doi: 10.1038/s42003-018-0238-9. eCollection 2018. Commun Biol. 2018. PMID: 30564751 Free PMC article.
-
Kinematics in the brain: unmasking motor control strategies?Exp Brain Res. 2017 Sep;235(9):2639-2651. doi: 10.1007/s00221-017-4982-8. Epub 2017 Jun 2. Exp Brain Res. 2017. PMID: 28573311 Free PMC article.
References
-
- Abe K, Asai Y, Matsuo Y, Nomura T, Sato S, Inoue S, Mizukura I, Sakoda S (2003): Classifying lower limb dynamics in Parkinson's disease. Brain Res Bull 61:219–226. - PubMed
-
- Aschersleben G (2002): Temporal control of movements in sensorimotor synchronization. Brain Cogn 48:66–79. - PubMed
-
- Aschersleben G, Prinz W (1995): Synchronizing actions with events: The role of sensory information. Percept Psychophys 57:305–317. - PubMed
-
- Aznárez‐Sanado M, Fernández‐Seara MA, Loayza FR, Pastor MA (2013): Functional asymmetries in early learning during right, left, and bimanual performance in right‐handed subjects. J Magn Reson Imaging 37:619–631. - PubMed
Publication types
MeSH terms
LinkOut - more resources
Full Text Sources
Other Literature Sources
