. 2016 Apr;202(4):1449-72.
doi: 10.1534/genetics.115.177931. Epub 2016 Feb 8.

Coalescent Inference Using Serially Sampled, High-Throughput Sequencing Data from Intrahost HIV Infection

Affiliations

Coalescent Inference Using Serially Sampled, High-Throughput Sequencing Data from Intrahost HIV Infection

Kevin Dialdestoro et al. Genetics. 2016 Apr.

Abstract

Human immunodeficiency virus (HIV) is a rapidly evolving pathogen that causes chronic infections, so genetic diversity within a single infection can be very high. High-throughput "deep" sequencing can now measure this diversity in unprecedented detail, particularly since it can be performed at different time points during an infection, and this offers a potentially powerful way to infer the evolutionary dynamics of the intrahost viral population. However, population genomic inference from HIV sequence data is challenging because of high rates of mutation and recombination, rapid demographic changes, and ongoing selective pressures. In this article we develop a new method for inference using HIV deep sequencing data, using an approach based on importance sampling of ancestral recombination graphs under a multilocus coalescent model. The approach further extends recent progress in the approximation of so-called conditional sampling distributions, a quantity of key interest when approximating coalescent likelihoods. The chief novelties of our method are that it is able to infer rates of recombination and mutation, as well as the effective population size, while handling sampling over different time points and missing data without extra computational difficulty. We apply our method to a data set of HIV-1, in which several hundred sequences were obtained from an infected individual at seven time points over 2 years. We find mutation rate and effective population size estimates to be comparable to those produced by the software BEAST. Additionally, our method is able to produce local recombination rate estimates. The software underlying our method, Coalescenator, is freely available.

Keywords: HIV evolution; coalescent; conditional sampling distribution; importance sampling; recombination.


Figures

Figure 1
Figure 1
Illustration of our two-locus recombination model: a sampled history ℋ and interevent times T. The two loci of each haplotype are each represented by a circle. White circles represent an unspecified locus and colored circles indicate the allelic type at that locus. For example, H0 consists of types (blue, red) and (green, ∗). There are two sampling times and the collected samples are represented by the leaves of the tree (marked by rectangles). Time is measured in chronological units and run backward from the most recent collection time, t0=0, to the most recent common ancestor, tMRCA. Ancestral lineages are represented by black lines. At a coalescence event, two lineages are joined together; the model allows coalescence between fully specified haplotypes (H4), between a fully specified and partially specified haplotype (H6), and between two partially specified haplotypes (H2). At a recombination event, two lineages are created and their haplotypes are partially specified: one of the two loci becomes nonancestral and its allele type is left unspecified (H1). At the next collection time t1, a new sample D1 is added to the existing lineages H2: H3=H2+D1; and the effective population size is allowed to change.
Figure 2
Figure 2
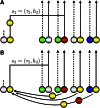
Illustration of the sequential interpretation for a realization of π^[e=(i,j)|n;Φ] for two loci. The dotted and solid lines, respectively, represent the marginal genealogies (S1,S2) at loci A and B. The hidden state at locus A is s1=(τ1,h1). Haplotype h1 would carry a green allele at its first locus, but a mutation results in the observed blue allele. The hidden state at locus B is s2=(τ2,h2). h2 carries a yellow allele at its second locus, and no mutation occurs on the marginal genealogy at this locus. If there is no recombination, s2=s1, but here a recombination occurs before τ2 and the absorption time for the second locus is τ2τ1. As in Figure 1, white circles represent loci with unspecified alleles.
Figure 3
Figure 3
Sampling π^[(,j)|n;Φ], with the observed allele j represented by a yellow circle. (A) Absorption at the second lineage of the trunk ancestry for which the second locus is specified (red allele). A mutation event is still allowed in this one-locus model, as illustrated here by a mutation from a red to a yellow allele. (B) Absorption at the first lineage of the trunk ancestry for which the second lineage is unspecified. In such cases we choose uniformly from the other informative lineages as the absorbing state.
Figure 4
Figure 4
Estimation of the local and global parameter estimates using the two-locus IS algorithm. A region of interest, typically ∼4–500 nt, is shown as a blue segment. This region is partitioned into smaller loci, e.g., 50 nt. Sequence reads are shown as thinner horizontal bars. For nonadjacent pairs of loci, the two-locus engine computes pairwise MLEs as local estimates of the population parameters. Here, a pairwise comparison between loci 2 and 4 is illustrated (yellow shading). Reads that fully cover at least one of the two loci are highlighted in red and are used for the inference: three complete haplotypes (reads 1, 4, and 6) and two partial haplotypes (reads 2 and 3). These pairwise inferences can be combined to reach the global parameter for the whole region. Two approaches are described in the text: by taking the median of the pairwise MLEs or via a pairwise composite likelihood.
Figure 5
Figure 5
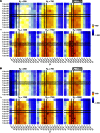
Likelihood surfaces on a pair of loci at positions (1, 50), (101, 150), for dataset Const-120, using 100 and 500 Monte Carlo iterations. Cells correspond to the searched parameters, colored by log-likelihoods, with the top 10 estimates numbered. The true mutation, recombination, and population parameters are μ¯=2.5×10⁵, r¯=106, Ne=103. (A) One hundred twenty sequences (Seqs), 100 iterations. (B) One hundred twenty Seqs, 500 iterations.
Figure 6
Figure 6
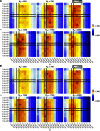
As in Figure 5 but for data set Const-600. (A) Six hundred Seqs, 100 iterations. (B) Six hundred Seqs, 500 iterations.
Figure 7
Figure 7
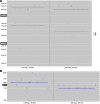
Population parameter estimates for simulated data sets generated under a constant population size model. The effect of using different combinations of sample size and number of Monte Carlo iterations is compared. Circles correspond to the pairwise MLEs between neighboring pairs of loci (those separated by 50 nt). The horizontal lines correspond to the median of the pairwise MLEs. Crosses indicate the pairwise composite-likelihood estimates. (A) Mutation and recombination rate estimates, per site per generation (1.8 days). (B) Effective population size estimates.
Figure 8
Figure 8
Population parameter estimates for simulated data sets generated under a dynamic population size model. Coalescenator was run under a constant population model, and this analysis shows its robustness to unmodeled changes in population size. Circles correspond to the pairwise MLEs between neighboring pairs of loci (those separated by 50 nt). The horizontal lines correspond to the median of the pairwise MLEs. Crosses indicate the pairwise composite-likelihood estimates. (A) Mutation and recombination rate estimates, per site per generation (1.8 days). (B) Estimates for effective population size.
Figure 9
Figure 9
Population parameter estimates for nine HIV gene regions. Data are from HIV genome alignments collected at seven time points over the period of 2 years. Circles correspond to the pairwise MLEs between neighboring pairs of loci separated by 50 nt. The horizontal lines correspond to the median of the pairwise MLEs. Crosses indicate the pairwise composite-likelihood estimates. (A) Mutation and recombination rate estimates, per site per generation (1.8 days). (B) Effective population size estimates.
Figure 10
Figure 10
Likelihood surfaces for the env 6415–7015 region, using 100 Monte Carlo iterations. Cells correspond to the searched parameters, colored by log-likelihoods, with the top 10 estimates numbered. (A) Likelihood surface for a single pair of loci within the region. (B) Pairwise composite likelihood aggregating all valid pairs of loci within the region.
Figure 11
Figure 11
Comparison of BEAST’s parameter estimates against Coalescenator’s. An identity line y=x is plotted in each case, to visually assess the agreement of the estimates by the two programs. The following abbreviations are used for the nine HIV gene regions: gag-1 = gag 311–940, gag-2 = gag 960–1560, pol-1 = pol 2005–2605, pol-2 = pol 2836–3436, pol-3 = pol 3796–4396, env-1 = env 5812–6412, env-2 = env 6415–7015, env-3 = env 7357–7957, nef = nef 8376–9011. (A) Comparison of mutation rate μ¯ estimates, converted to the number of substitutions per site per year. (B) Comparison of effective population size Ne estimates. (C) Comparison of BEAST’s time to the most recent common ancestor TMRCA estimates, against Coalescenator’s time until five ancestors is reached, TMRCA5 estimates, given in years.

References

    1. Abramowitz, M., and I. Stegun (Editors), 1972 Handbook of Mathematical Functions with Formulas, Graphs, and Mathematical Tables (National Bureau of Standards Applied Mathematics Series, Ed. 10, Vol. 55). Dover Publications, New York, USA.
    1. Alizon S., Fraser C., 2013. Within-host and between-host evolutionary rates across the HIV-1 genome. Retrovirology 10(1): 49. - PMC - PubMed
    1. Anderson E. C., 2005. An efficient Monte Carlo method for estimating Ne from temporally spaced samples using a coalescent-based likelihood. Genetics 170: 955–967. - PMC - PubMed
    1. Archer J., Pinney J. W., Fan J., Simon-Loriere E., Arts E. J., et al. , 2008. Identifying the important HIV-1 recombination breakpoints. PLoS Comput. Biol. 4: e10000178. - PMC - PubMed
    1. Arenas M., Posada D., 2010. Coalescent simulation of intracodon recombination. Genetics 184: 429–437. - PMC - PubMed

Publication types