

A new approach to define acute kidney injury in term newborns with hypoxic ischemic encephalopathy
- PMID: 26857710
- PMCID: PMC4882244
- DOI: 10.1007/s00467-016-3317-5
A new approach to define acute kidney injury in term newborns with hypoxic ischemic encephalopathy
Abstract
Background: Current definitions of acute kidney injury (AKI) are not sufficiently sensitive to identify all newborns with AKI during the first week of life.
Methods: To determine whether the rate of decline of serum creatinine (SCr) during the first week of life can be used to identify newborns with AKI, we reviewed the medical records of 106 term neonates at risk of AKI who were treated with hypothermia for hypoxic ischemic encephalopathy (HIE).
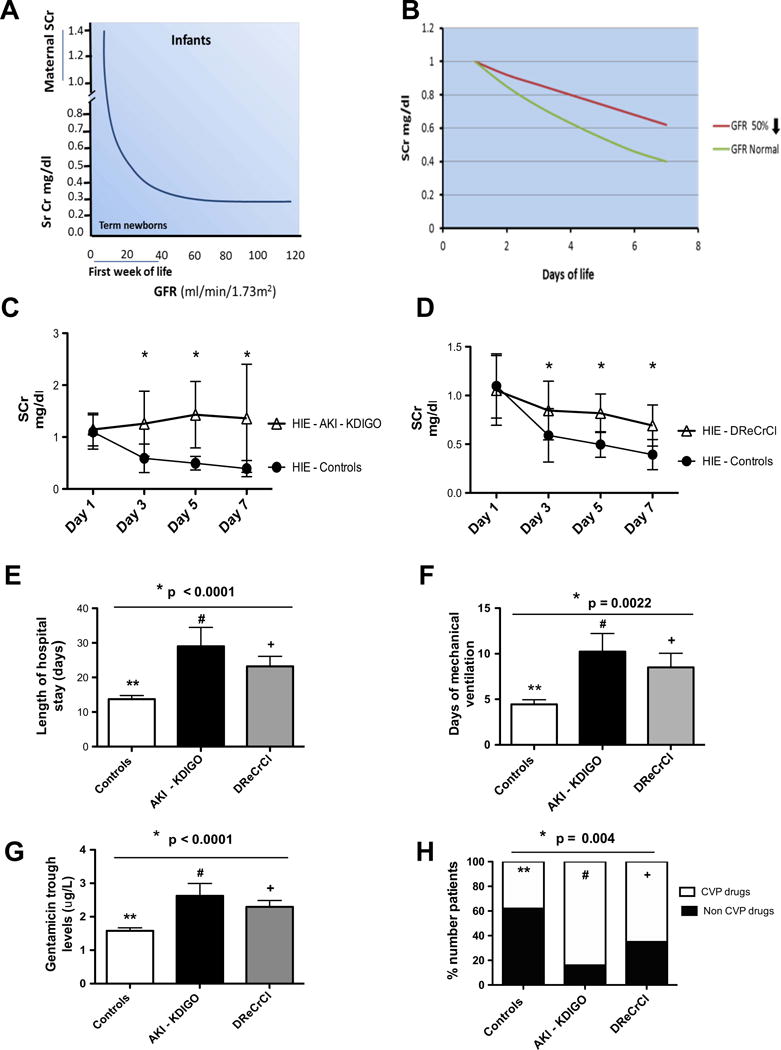
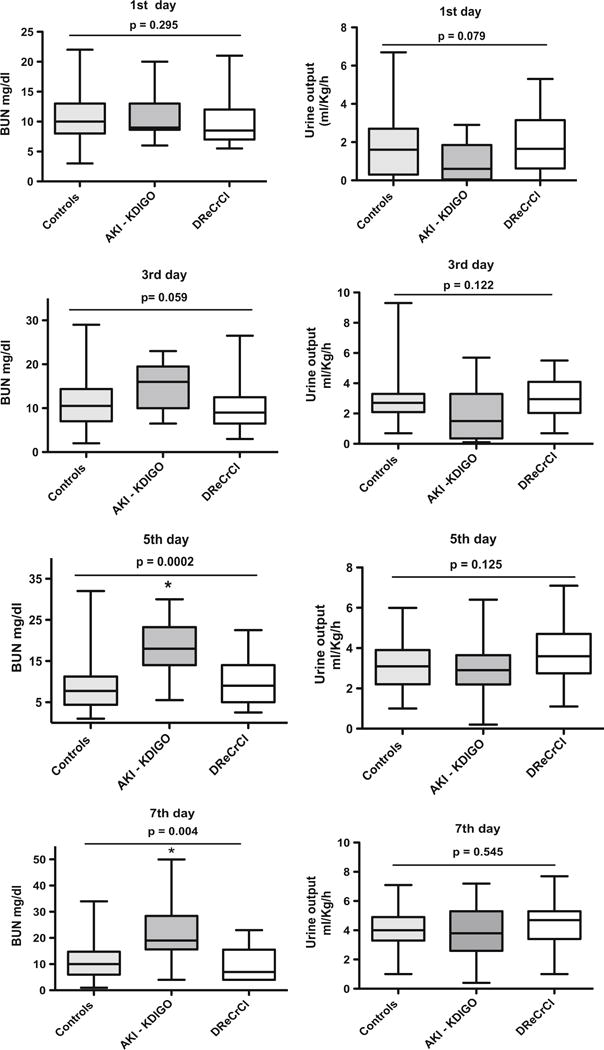
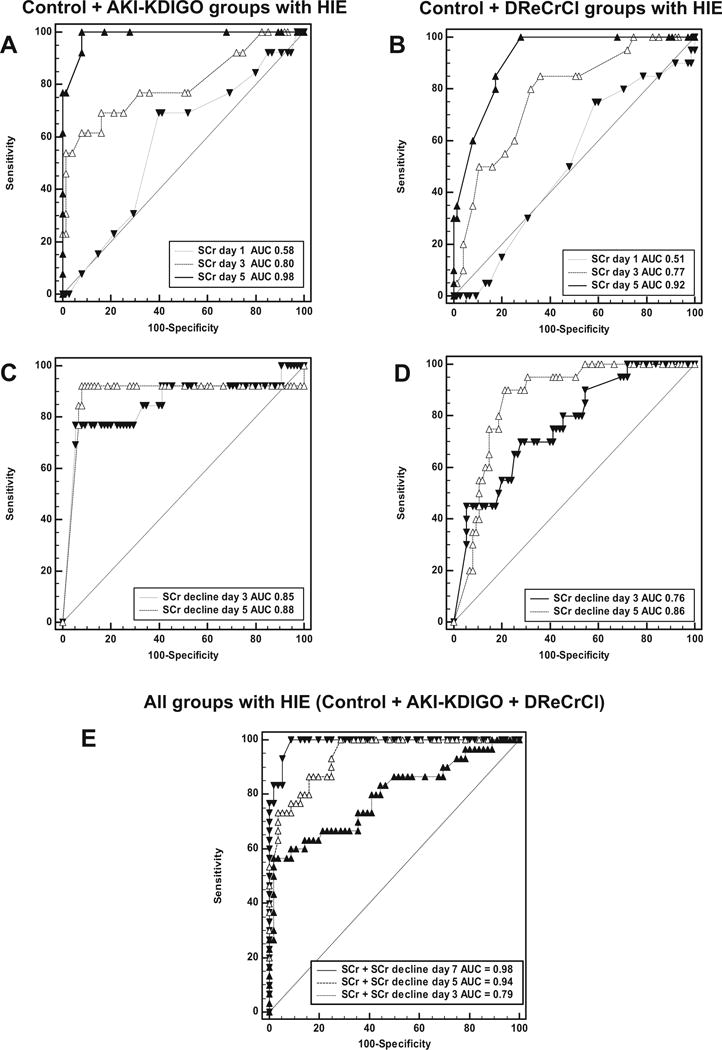
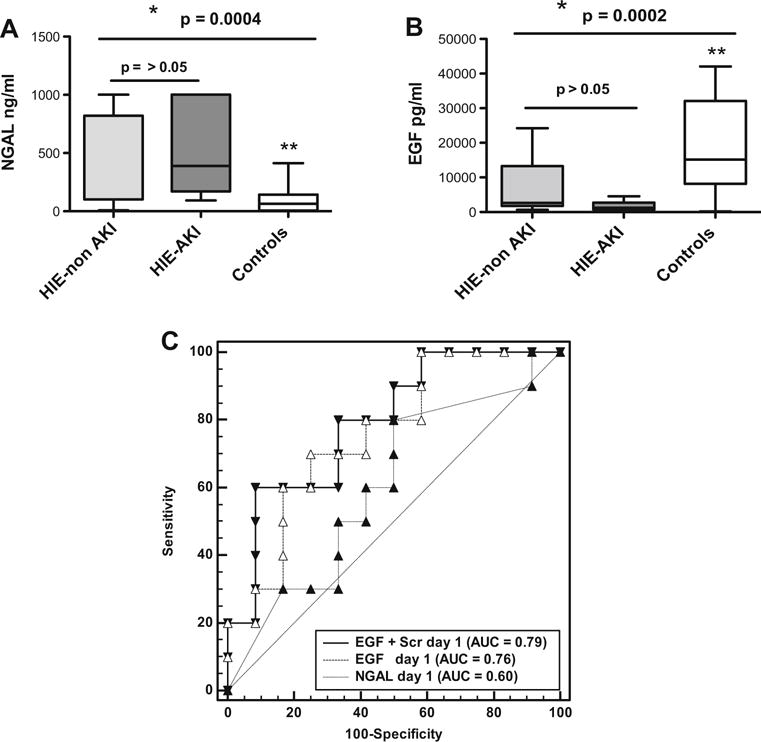
Results: Of the newborns enrolled in the study, 69 % showed a normal rate of decline of SCr to ≥50 % and/or reached SCr levels of ≤0.6 mg/dl before the 7th day of life, and therefore had an excellent clinical outcome (control group). Thirteen newborns with HIE (12 %) developed AKI according to an established neonatal definition (AKI-KIDGO group), and an additional 20 newborns (19 %) showed a rate of decline of SCr of <33, <40, and <46 % from birth to days 3, 5, or 7 of life, respectively (delayed rise in estimated SCr clearance group). Compared to the control group, newborns in the other two groups required more days of mechanical ventilation and vasopressor drugs and had higher gentamicin levels, more fluid overload, lower urinary epidermal growth factor levels, and a prolonged length of stay.
Conclusions: The rate of decline of SCr provides a sensitive approach to identify term newborns with AKI during the first week of life.
Keywords: Acute kidney injury; Biomarkers; Epidermal growth factor; Neonate; Serum creatinine.
Conflict of interest statement
Figures
Similar articles
-
Acute kidney injury in neonates with hypoxic ischemic encephalopathy based on serum creatinine decline compared to KDIGO criteria.Pediatr Nephrol. 2024 Sep;39(9):2789-2796. doi: 10.1007/s00467-024-06287-8. Epub 2024 Feb 7. Pediatr Nephrol. 2024. PMID: 38326648
-
Acute kidney injury in premature newborns-definition, etiology, and outcome.Pediatr Nephrol. 2017 Oct;32(10):1963-1970. doi: 10.1007/s00467-017-3690-8. Epub 2017 May 29. Pediatr Nephrol. 2017. PMID: 28555296
-
Acute kidney injury in asphyxiated newborns treated with therapeutic hypothermia.J Pediatr. 2013 Apr;162(4):725-729.e1. doi: 10.1016/j.jpeds.2012.10.002. Epub 2012 Nov 10. J Pediatr. 2013. PMID: 23149172
-
Molecular markers for ischemia, do we have something better then creatinine and glomerular filtration rate?Arch Esp Urol. 2013 Jan-Feb;66(1):99-114. Arch Esp Urol. 2013. PMID: 23406805 Review.
-
Biomarkers of renal function, which and when?Clin Chim Acta. 2015 Jan 1;438:350-7. doi: 10.1016/j.cca.2014.08.039. Epub 2014 Sep 3. Clin Chim Acta. 2015. PMID: 25195004 Review.
Cited by
-
A New Approach to Recognize Neonatal Impaired Kidney Function.Kidney Int Rep. 2020 Oct 3;5(12):2301-2312. doi: 10.1016/j.ekir.2020.09.043. eCollection 2020 Dec. Kidney Int Rep. 2020. PMID: 33305124 Free PMC article.
-
Gentamicin Pharmacokinetics in Neonates Undergoing Therapeutic Hypothermia for Hypoxic Ischemic Encephalopathy.Paediatr Drugs. 2025 Jan;27(1):85-90. doi: 10.1007/s40272-024-00661-7. Epub 2024 Oct 24. Paediatr Drugs. 2025. PMID: 39446309
-
Incidence and risk factors associated with acute kidney injury in newborns receiving therapeutic hypothermia.Pediatr Nephrol. 2025 Aug 19. doi: 10.1007/s00467-025-06926-8. Online ahead of print. Pediatr Nephrol. 2025. PMID: 40828176
-
Positive fluid balance is associated with death and severity of brain injury in neonates with hypoxic-ischemic encephalopathy.J Perinatol. 2021 Jun;41(6):1331-1338. doi: 10.1038/s41372-021-00988-w. Epub 2021 Mar 1. J Perinatol. 2021. PMID: 33649446 Free PMC article.
-
Creatinine Trends and Patterns in Neonates Undergoing Whole Body Hypothermia: A Systematic Review.Children (Basel). 2021 Jun 4;8(6):475. doi: 10.3390/children8060475. Children (Basel). 2021. PMID: 34200017 Free PMC article. Review.
References
-
- Shankaran S. Outcomes of hypoxic-ischemic encephalopathy in neonates treated with hypothermia. Clin Perinatol. 2014;41:149–159. - PubMed
-
- Shankaran S, Laptook AR, Ehrenkranz RA, Tyson JE, McDonald SA, Donovan EF, Fanaroff AA, Poole WK, Wright LL, Higgins RD, Finer NN, Carlo WA, Duara S, Oh W, Cotten CM, Stevenson DK, Stoll BJ, Lemons JA, Guillet R, Jobe AH, National Institute of Child H Human Development Neonatal Research N Wholebody hypothermia for neonates with hypoxic-ischemic encephalopathy. N Engl J Med. 2005;353:1574–1584. - PubMed
-
- Shankaran S, Laptook AR, McDonald SA, Higgins RD, Tyson JE, Ehrenkranz RA, Das A, Sant’Anna G, Goldberg RN, Bara R, Walsh MC, Eunice Kennedy Shriver National Institute of Child H, Human Development Neonatal Research Network Temperature profile and outcomes of neonates undergoing whole body hypothermia for neonatal hypoxic-ischemic encephalopathy. Pediatr Crit Care Med. 2012;13:53–59. - PMC - PubMed
-
- Sarkar S, Askenazi DJ, Jordan BK, Bhagat I, Bapuraj JR, Dechert RE, Selewski DT. Relationship between acute kidney injury and brain MRI findings in asphyxiated newborns after therapeutic hypothermia. Pediatr Res. 2014;75:431–435. - PubMed
-
- Selewski DT, Jordan BK, Askenazi DJ, Dechert RE, Sarkar S. Acute kidney injury in asphyxiated newborns treated with therapeutic hypothermia. J Pediatr. 2013;162(725–729):e721. - PubMed
Publication types
MeSH terms
Substances
Grants and funding
LinkOut - more resources
Full Text Sources
Other Literature Sources
