. 2016 Mar 31;198(8):1294-304.
doi: 10.1128/JB.00913-15. Print 2016 Apr.

Distinct Contributions of Enzymic Functional Groups to the 2',3'-Cyclic Phosphodiesterase, 3'-Phosphate Guanylylation, and 3'-ppG/5'-OH Ligation Steps of the Escherichia coli RtcB Nucleic Acid Splicing Pathway

Affiliations

Distinct Contributions of Enzymic Functional Groups to the 2',3'-Cyclic Phosphodiesterase, 3'-Phosphate Guanylylation, and 3'-ppG/5'-OH Ligation Steps of the Escherichia coli RtcB Nucleic Acid Splicing Pathway

William P Maughan et al. J Bacteriol. .

Abstract

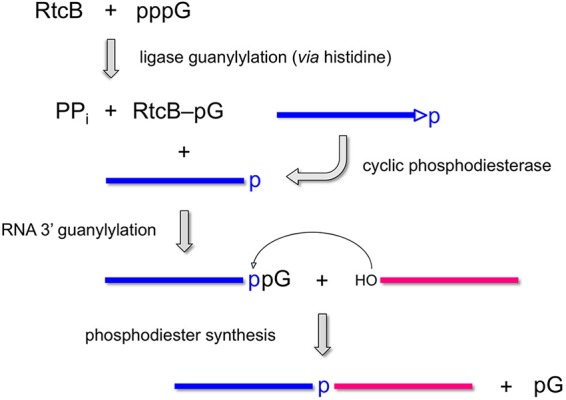
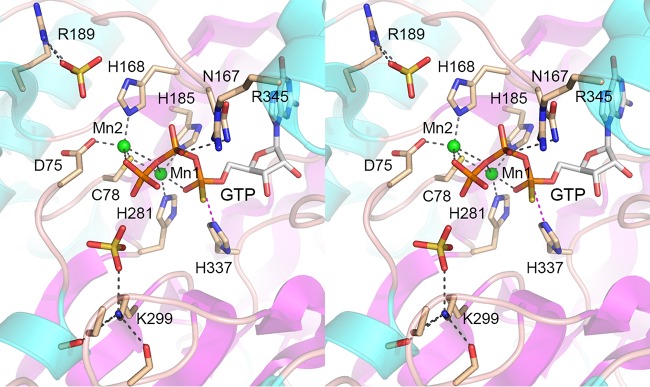
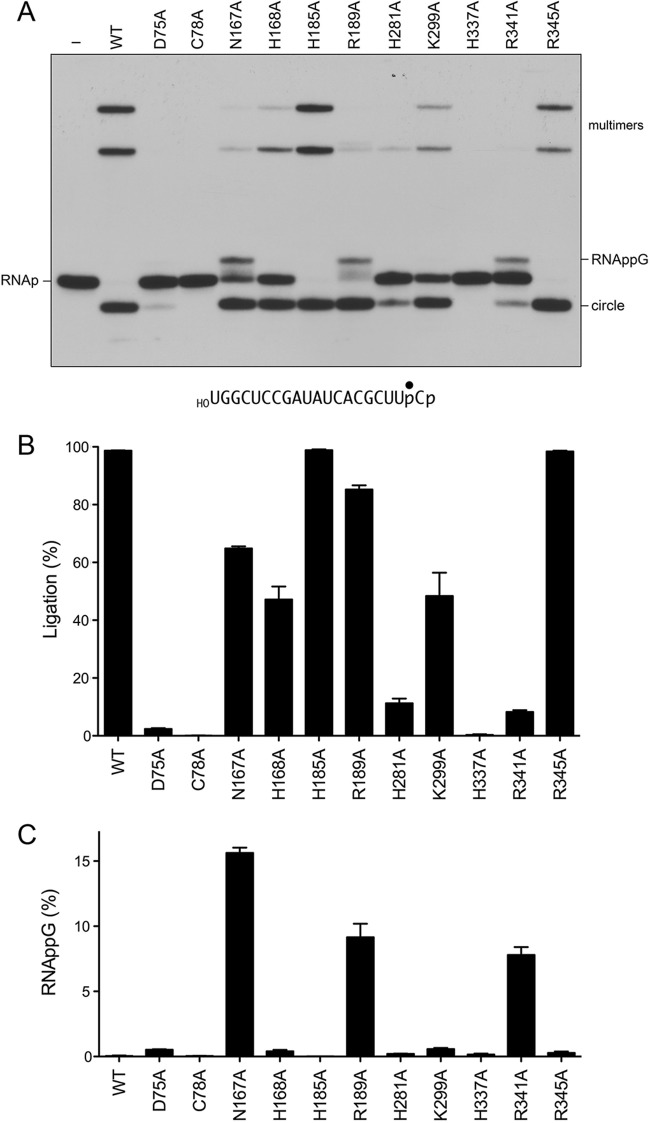
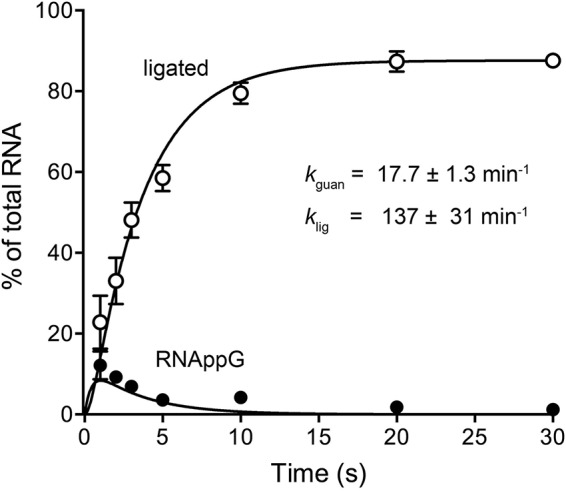
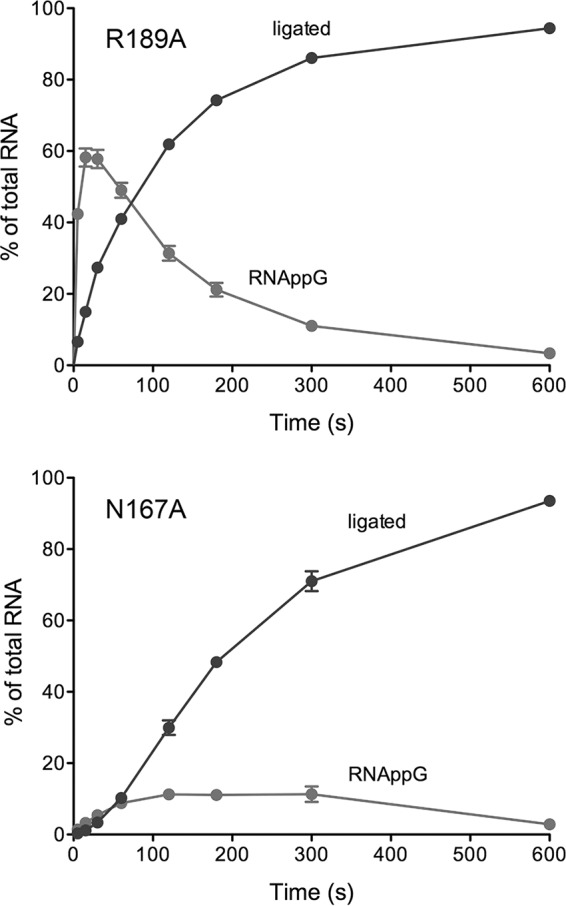
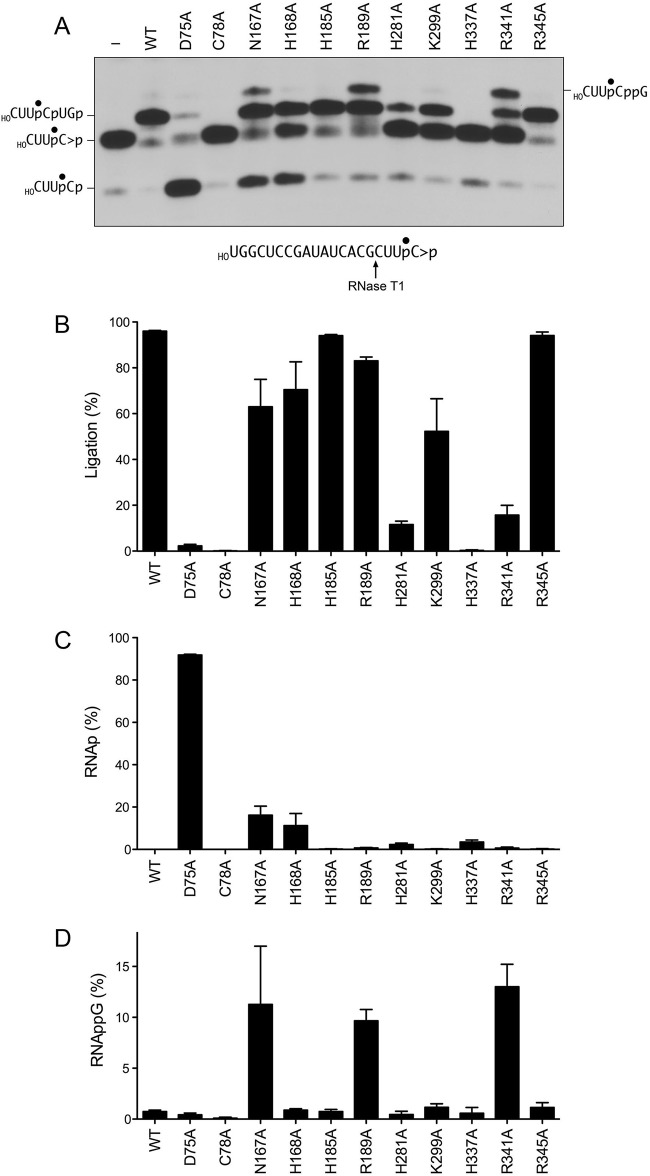
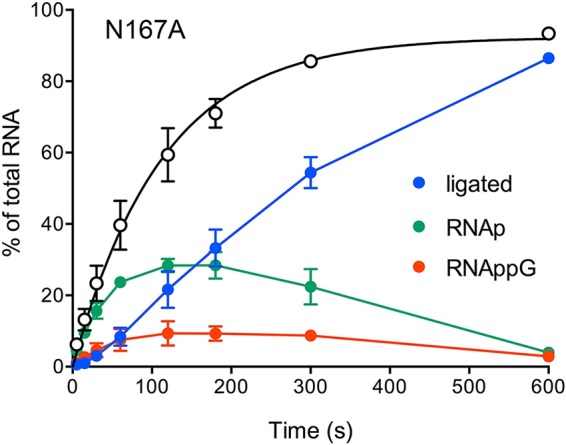
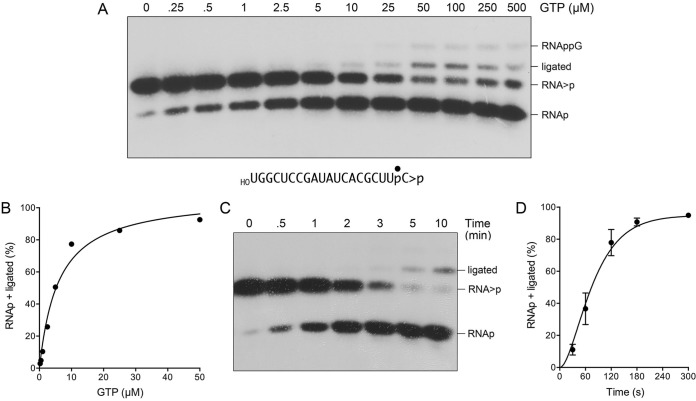
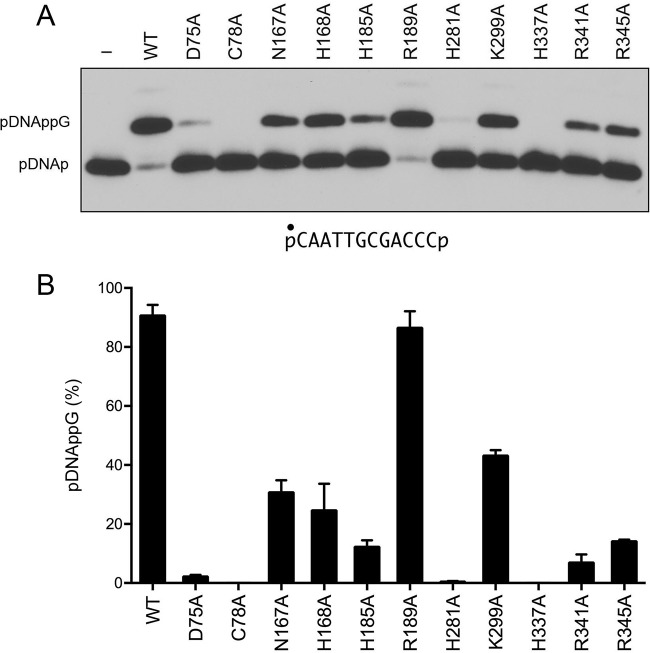
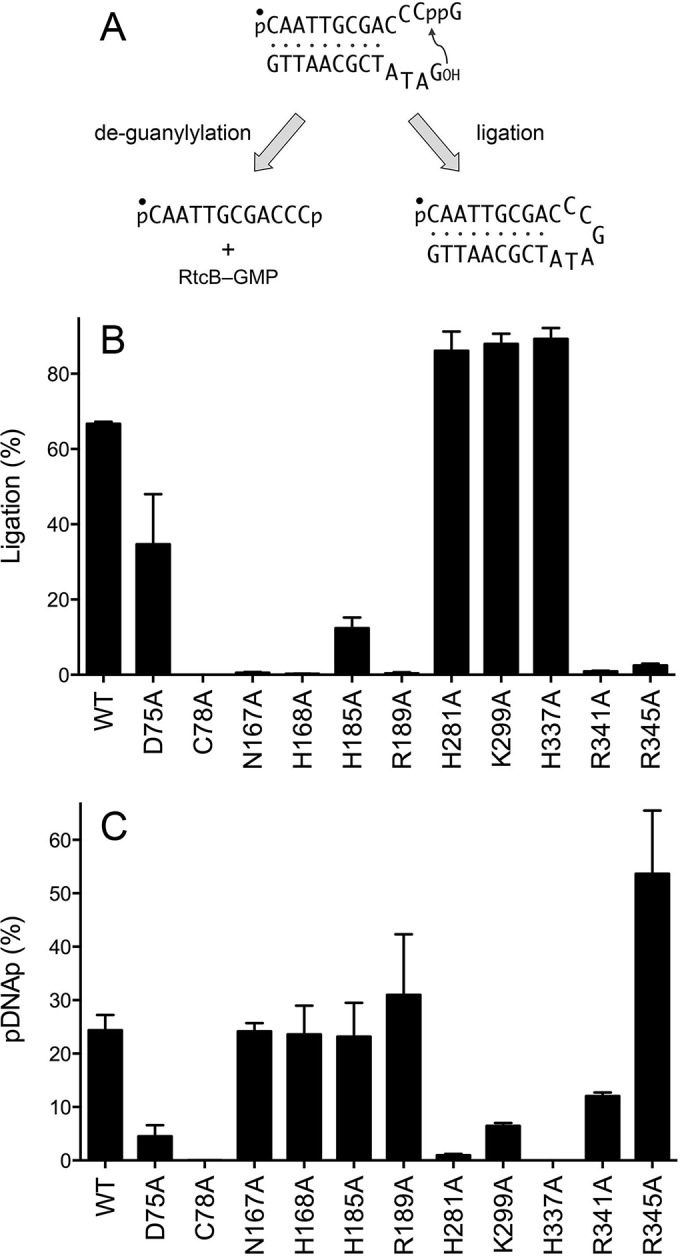
Escherichia coli RtcB is a founding member of a family of manganese-dependent RNA repair enzymes that join RNA 2′,3′-cyclic phosphate (RNA>p) or RNA 3′-phosphate (RNAp) ends to 5′-OH RNA (HORNA) ends in a multistep pathway whereby RtcB (i) hydrolyzes RNA>p to RNAp, (ii) transfers GMP from GTP to RNAp to form to RNAppG, and (iii) directs the attack of 5′-OH on RNAppG to form a 3′-5′ phosphodiester splice junction. The crystal structure of the homologous archaeal RtcB enzyme revealed an active site with two closely spaced manganese ions, Mn1 and Mn2, that interact with the GTP phosphates. By studying the reactions of wild-type E. coli RtcB and RtcB alanine mutants with 3′-phosphate-, 2′,3′-cyclic phosphate-, and 3′-ppG-terminated substrates, we found that enzymic constituents of the two metal coordination complexes (Cys78, His185, and His281 for Mn1 and Asp75, Cys78, and His168 for Mn2 in E. coli RtcB) play distinct catalytic roles. For example, whereas the C78A mutation abolished all steps assayed, the D75A mutation allowed cyclic phosphodiester hydrolysis but crippled 3′-phosphate guanylylation, and the H281A mutant was impaired in overall HORNAp and HORNA>p ligation but was able to seal a preguanylylated substrate. The archaeal counterpart of E. coli RtcB Arg189 coordinates a sulfate anion construed to mimic the position of an RNA phosphate. We propose that Arg189 coordinates a phosphodiester at the 5′-OH end, based on our findings that the R189A mutation slowed the step of RNAppG/HORNA sealing by a factor of 200 compared to that with wild-type RtcB while decreasing the rate of RNAppG formation by only 3-fold.

Importance: RtcB enzymes comprise a widely distributed family of manganese- and GTP-dependent RNA repair enzymes that ligate 2′,3′-cyclic phosphate ends to 5′-OH ends via RNA 3′-phosphate and RNA(3′)pp(5′)G intermediates. The RtcB active site includes two adjacent manganese ions that engage the GTP phosphates. Alanine scanning of Escherichia coli RtcB reveals distinct contributions of metal-binding residues Cys78, Asp75, and His281 at different steps of the RtcB pathway. The RNA contacts of RtcB are uncharted. Mutagenesis implicates Arg189 in engaging the 5′-OH RNA end.


Figures

FIG 1
FIG 1
Multistep pathway of RtcB-catalyzed RNA ligation. See the text for details.
FIG 2
FIG 2
Structure of an RtcB-GTP-(Mn2+)2 complex. Shown is a stereo view of the active site of P. horikoshii RtcB (PDB accession number 4ISZ) highlighting atomic interactions of two manganese ions (Mn1 and Mn2) (depicted as green spheres) and GTPαS (stick model with gray carbons). The RtcB fold is shown as a cartoon model with magenta β strands and cyan α helices. Selected RtcB amino acids are depicted as stick models with beige carbons. Amino acids are numbered according to their equivalents in E. coli RtcB. Two sulfate anions (stick models) in the vicinity of GTPαS are suggested to mimic RNA phosphates. Atomic contacts are indicated by black dashed lines. His337-Nε is poised for nucleophilic attack on the GTP α phosphorus, as denoted by the magenta dashed line.
FIG 3
FIG 3
RtcB mutants. Aliquots (5 μg) of the indicated RtcB preparations were analyzed by SDS-PAGE. A Coomassie blue-stained gel is shown. The positions and sizes (kilodaltons) of marker polypeptides are indicated on the left. WT, wild type.
FIG 4
FIG 4
Mutational effects on HORNAp ligation. (A) Reaction mixtures (10 μl) containing 50 mM Tris-HCl (pH 8.0), 2 mM MnCl2, 100 μM GTP, 0.1 μM 20-mer HORNAp (depicted at the bottom, with the radiolabeled phosphate denoted by ●), and either 1 μM RtcB as specified or no RtcB (lane −) were incubated at 37°C for 5 min. The products were analyzed by urea-PAGE. An autoradiograph of the gel is shown. The identities of the radiolabeled RNAs are indicated at the left and right. (B and C) The extents of RNA ligation (circle plus multimers) (B) and RNAppG accumulation (C), expressed as a percentage of the total radiolabeled RNA, are plotted in bar graph format. Each datum is the average of results from three experiments ± the standard error of the mean.
FIG 5
FIG 5
Kinetic profile of HORNAp ligation by wild-type RtcB. Reaction mixtures (10 μl) containing 50 mM Tris-HCl (pH 8.0), 2 mM MnCl2, 100 μM GTP, 1 μM RtcB, and 0.1 μM HORNAp were incubated at 37°C. The reactions were quenched with formamide-EDTA at the times specified. The products were resolved by urea-PAGE and quantified by scanning of the gel. The levels of RNAppG and ligated RNAs are plotted as a function of time. Each datum is the average of results from three experiments ± the standard error of the mean. The data were fit by nonlinear regression in Prism to a two-step kinetic mechanism (HORNAp → HORNAppG → ligated RNA) with rate constants, kguan and klig, as indicated.
FIG 6
FIG 6
Kinetic profiles of HORNAp ligation by the R189A and N167A mutants. Reaction mixtures containing 50 mM Tris-HCl (pH 8.0), 2 mM MnCl2, 100 μM GTP, 0.1 μM HORNAp, and 1 μM the RtcB mutant R189A or N167A were incubated at 37°C. Aliquots (10 μl) were withdrawn at the times specified and quenched immediately with formamide-EDTA. The products were resolved by urea-PAGE and quantified by scanning of the gel. The levels of RNAppG and ligated RNAs are plotted as a function of time. Each datum is the average of results from three experiments ± the standard error of the mean.
FIG 7
FIG 7
Mutational effects on HORNA>p ligation. (A) Reaction mixtures (10 μl) containing 50 mM Tris-HCl (pH 8.0), 2 mM MnCl2, 100 μM GTP, 0.1 μM 20-mer HORNA>p (depicted at the bottom, with the radiolabeled phosphate denoted by ●), and either 1 μM RtcB as specified or no RtcB (lane −) were incubated at 37°C for 5 min. The mixtures were digested with RNase T1 and then analyzed by urea-PAGE. An autoradiograph of the gel is shown. The identities of the radiolabeled RNase T1 fragments are indicated at the left and right. (B to D) The extents of RNA ligation (HOCUUpCpUGp) (B) and accumulation of RNAp (HOCUUpCp) (C) and RNAppG (HOCUUpCppG) (D), expressed as a percentage of the total radiolabeled RNA, are plotted in bar graph format. Each datum is the average of results from three experiments ± the standard error of the mean.
FIG 8
FIG 8
Kinetic profile of HORNA>p ligation by the N167A mutant. Reaction mixtures containing 50 mM Tris-HCl (pH 8.0), 2 mM MnCl2, 100 μM GTP, 0.1 μM 20-mer HORNA>p, and 1 μM RtcB N167A mutant were incubated at 37°C. Aliquots (10 μl) were withdrawn at the times specified, quenched with EDTA, digested with RNase T1, mixed with formamide-EDTA, and then analyzed by urea-PAGE. The extents of RNA ligation and accumulation of RNAp and RNAppG, expressed as a percentage of the total radiolabeled RNA, are plotted as a function of time. Each datum is the average of results from three experiments ± the standard error of the mean. The open circles denote RNAp plus RNAppG plus ligated RNA (as a percentage of the total RNA) with a fit of the data to a single exponential curve.
FIG 9
FIG 9
CPDase activity of the D75A mutant. (A and B) Reaction mixtures (10 μl) containing 50 mM Tris-HCl (pH 8.0), 2 mM MnCl2, 0.1 μM 20-mer HORNA>p (depicted at the bottom, with the radiolabeled phosphate denoted by ●), 1 μM RtcB D75A mutant, and GTP as specified were incubated at 37°C for 5 min. The mixtures were digested with RNase T1 and then analyzed by urea-PAGE. An autoradiograph of the gel is shown. The identities of the radiolabeled RNase T1 fragments are indicated at the right. The extent of 2′,3′-cyclic phosphodiester hydrolysis (RNAp plus ligated RNA) is plotted as a function of the GTP concentration (B). (C) A reaction mixture containing 50 mM Tris-HCl (pH 8.0), 2 mM MnCl2, 100 μM GTP, 0.1 μM 20-mer HORNA>p, and 1 μM RtcB D75A mutant was incubated at 37°C. Aliquots (10 μl) were withdrawn at the times specified and quenched with EDTA. The RNAs were digested with RNase T1, and the products were analyzed by urea-PAGE. An autoradiograph of the gel is shown. (D) The extent of 2′,3′-cyclic phosphodiester hydrolysis (RNAp plus ligated RNA) is plotted as a function of time. Each datum is the average of results from three experiments ± the standard error of the mean.
FIG 10
FIG 10
Mutational effects on DNA 3′-phosphate capping. (A) Reaction mixtures (10 μl) containing 50 mM Tris-HCl (pH 8.0), 2 mM MnCl2, 100 μM GTP, 0.1 μM 12-mer pDNAp (depicted at the bottom, with the radiolabeled phosphate denoted by ●), and either 1 μM RtcB as specified or no RtcB (lane −) were incubated at 37°C for 5 min. The products were analyzed by urea-PAGE. An autoradiograph of the gel is shown. The pDNAp substrate and capped pDNAppG product are indicated at the left. (B) The extents of DNAppG formation are plotted in bar graph format. Each datum is the average of results from three experiments ± the standard error of the mean.
FIG 11
FIG 11
Mutational effects of DNAppG ligation and deguanylylation. (A) Reactions of RtcB with a preguanylylated pDNAppG/HODNA stem-loop substrate. The 5′ 32P label on the pDNAppG strand is denoted by ●. (B and C) Reaction mixtures (10 μl) containing 50 mM Tris-HCl (pH 8.0), 2 mM MnCl2, 100 μM GTP, 0.1 μM 12-mer pDNAppG stem-loop, and 1 μM RtcB as specified were incubated at 37°C for 5 min. The products were resolved by urea-PAGE and quantified by scanning of the gel. The extents of DNAppG ligation (B) and deguanylylation to pDNAp (C) are plotted in bar graph format. Each datum is the average of results from three experiments ± the standard error of the mean.

Similar articles

Cited by

References

    1. Tanaka N, Shuman S. 2011. RtcB is the RNA ligase component of an Escherichia coli RNA repair operon. J Biol Chem 286:7727–7731. doi:10.1074/jbc.C111.219022. - DOI - PMC - PubMed
    1. Tanaka N, Meineke B, Shuman S. 2011. RtcB, a novel RNA ligase, can catalyze tRNA splicing and HAC1 mRNA splicing in vivo. J Biol Chem 286:30253–30257. doi:10.1074/jbc.C111.274597. - DOI - PMC - PubMed
    1. Englert M, Sheppard K, Aslanian A, Yates JR, Söll D. 2011. Archaeal 3′-phosphate RNA splicing ligase characterization identified the missing component in tRNA maturation. Proc Natl Acad Sci U S A 108:1290–1295. doi:10.1073/pnas.1018307108. - DOI - PMC - PubMed
    1. Popow J, Englert M, Weitzer S, Schleiffer A, Mierzwa B, Mechtler K, Trowitzsch S, Will CL, Lürhmann R, Söll D, Martinez J. 2011. HSPC117 is the essential subunit of a human tRNA splicing ligase complex. Science 331:760–764. doi:10.1126/science.1197847. - DOI - PubMed
    1. Tanaka N, Chakravarty AK, Maughan B, Shuman S. 2011. Novel mechanism of RNA repair by RtcB via sequential 2′,3′-cyclic phosphodiesterase and 3′-phosphate/5′-hydroxyl ligation reactions. J Biol Chem 286:43134–43143. doi:10.1074/jbc.M111.302133. - DOI - PMC - PubMed

Publication types

MeSH terms

LinkOut - more resources