. 2016 Feb 9:11:16.
doi: 10.1186/s13024-016-0082-7.

Metformin promotes tau aggregation and exacerbates abnormal behavior in a mouse model of tauopathy

Affiliations

Metformin promotes tau aggregation and exacerbates abnormal behavior in a mouse model of tauopathy

Erica Barini et al. Mol Neurodegener. .

Abstract

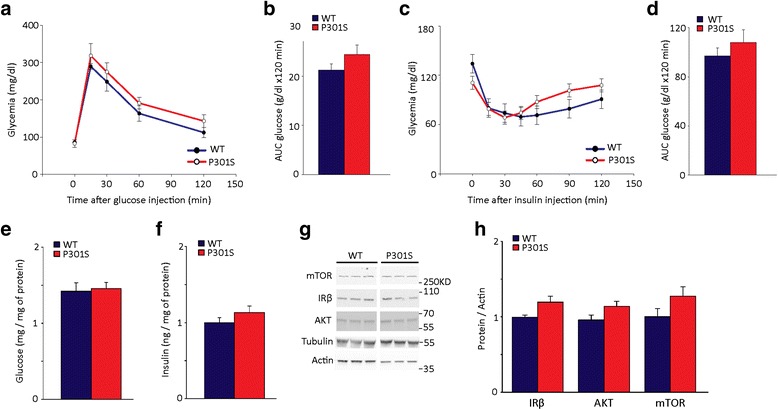
Background: Alzheimer disease (AD) and other tauopathies develop cerebral intracellular inclusions of hyperphosphorylated tau. Epidemiological and experimental evidence suggests a clear link between type 2 diabetes mellitus and AD. In AD animal models, tau pathology is exacerbated by metabolic comorbidities, such as insulin resistance and diabetes. Within this context, anitidiabetic drugs, including the widely-prescribed insulin-sensitizing drug metformin, are currently being investigated for AD therapy. However, their efficacy for tauopathy in vivo has not been tested.

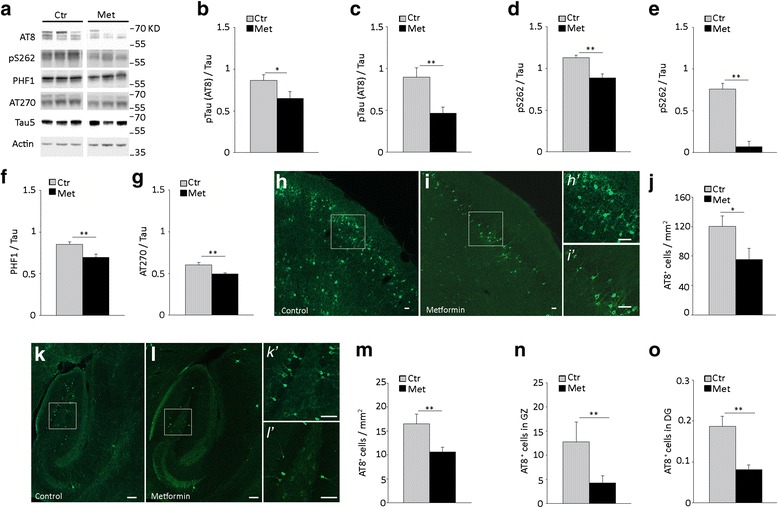
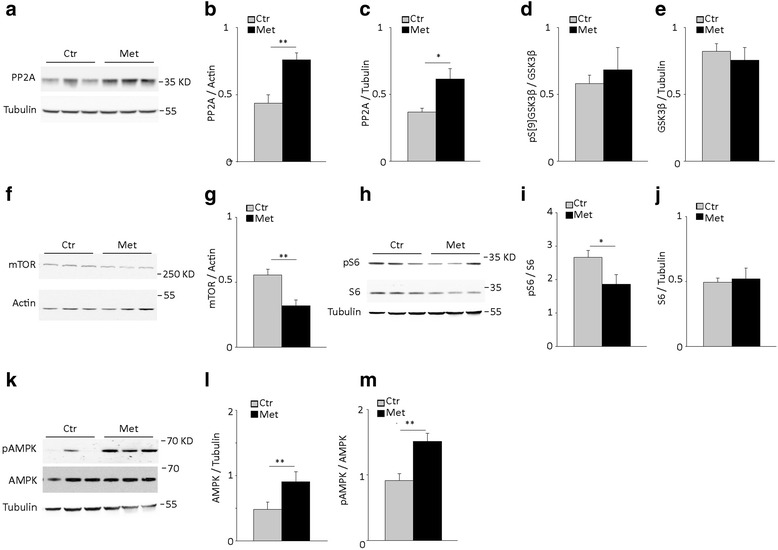
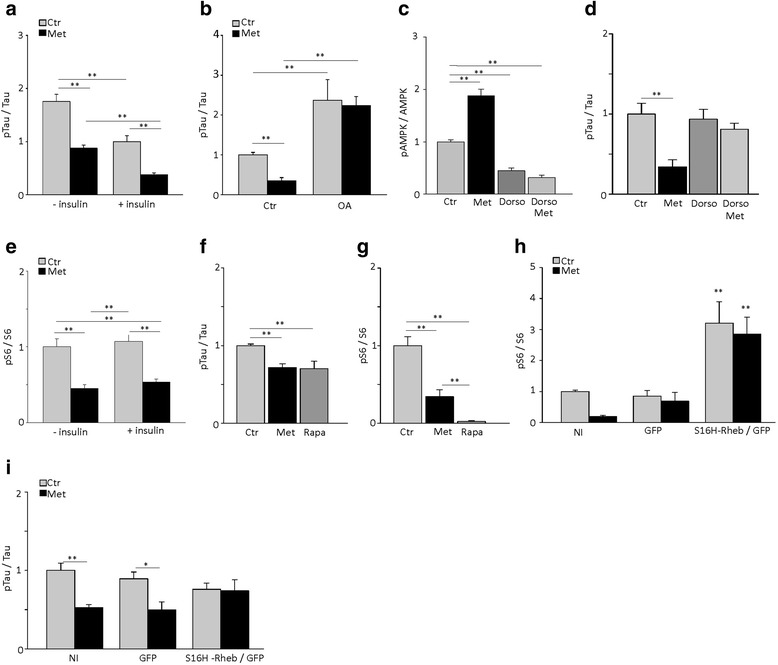
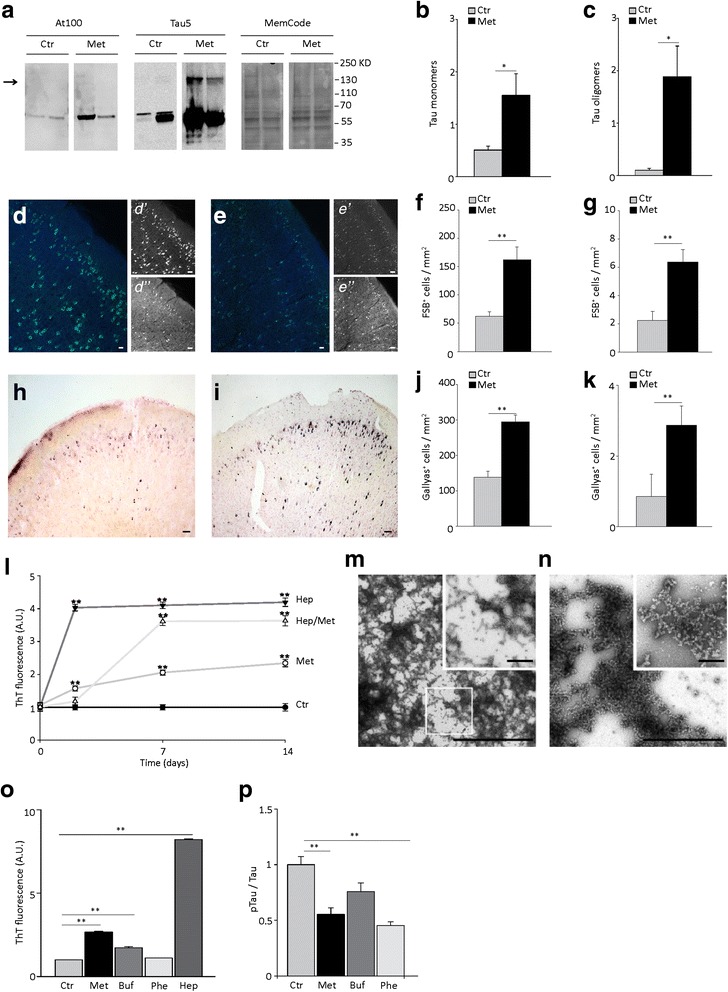
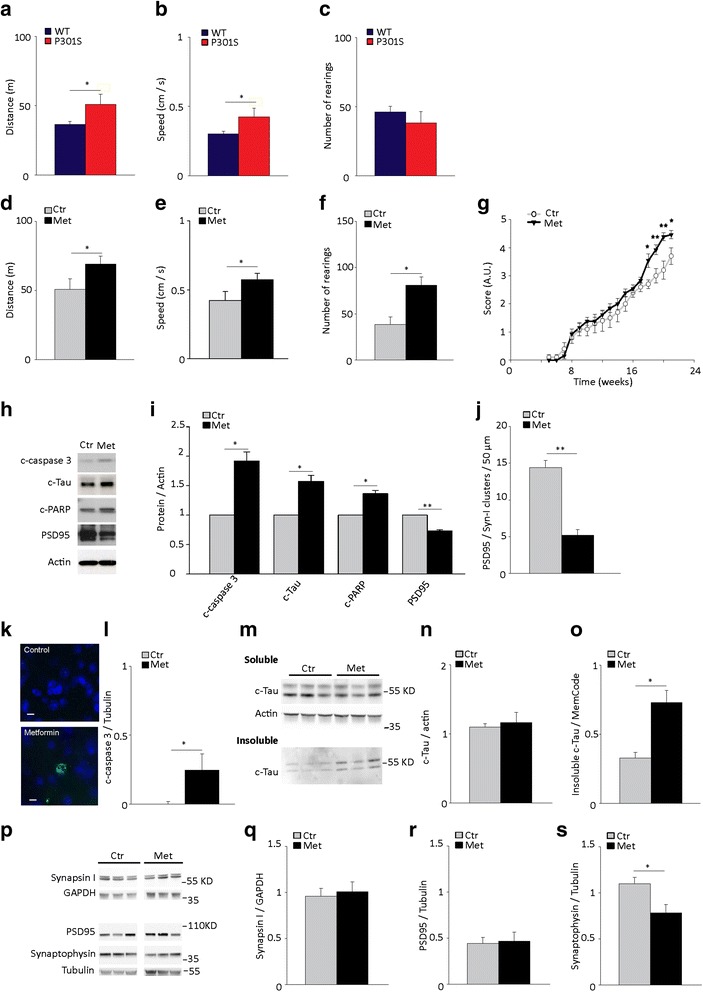
Results: Here, we report that in the P301S mutant human tau (P301S) transgenic mouse model of tauopathy, chronic administration of metformin exerts paradoxical effects on tau pathology. Despite reducing tau phosphorylation in the cortex and hippocampus via AMPK/mTOR and PP2A, metformin increases insoluble tau species (including tau oligomers) and the number of inclusions with β-sheet aggregates in the brain of P301S mice. In addition, metformin exacerbates hindlimb atrophy, increases P301S hyperactive behavior, induces tau cleavage by caspase 3 and disrupts synaptic structures.

Conclusions: These findings indicate that metformin pro-aggregation effects mitigate the potential benefits arising from its dephosphorylating action, possibly leading to an overall increase of the risk of tauopathy in elderly diabetic patients.


Figures

Fig. 1
Fig. 1
P301S mice show neither peripheral nor brain insulin resistance. a Intraperitoneal glucose tolerance test (IPGTT) in 5 month old WT non-transgenic and P301S transgenic mice. At time 0, P = 0.9; 15 min, P = 0.29; 30 min, P = 0.33; 60 min, P = 0.3; 120 min, P = 0.26; two-way ANOVA followed by Holm-Sidak multiple comparison test. P301S, n = 10; WT, n = 12. b IPGTT AUC. P = 0.17; Student t-test. c Insulin tolerance test (ITT) in 5 month old WT non-transgenic and P301S transgenic mice. At time 0, P = 0.09; 15 min, P = 0.95, 30 min, P = 0.69; 45 min, P = 0.73; 60 min, P = 0.24; 90 min, P = 0.11; 120 min, P = 0.22; two-way ANOVA followed by Holm-Sidak multiple comparison test. P301S, n = 12; WT, n = 6. In a and c, data points represent the average glycemia ± SEM. d ITT AUC. P = 0.50, Student t-test. e-f Glucose concentration (e) and insulin levels (f) in the cortex of 5-month old P301S and WT mice. n = 6 / group. Glucose and insulin concentrations were normalized to the sample protein content. Bars represent the average ± SEM. In panel e, P = 0.79; panel f, P = 0.24; Student t-test. g Western blot of mTOR, IRβ and Akt and total tau in the cortex. Actin and Tubulin were analyzed as a loading control. h Quantitative analysis of protein expression of IRβ (WT, n = 9; P301S, n = 12), AKT (WT, n = 8; P301S, n = 12) and mTOR (WT, n = 6; P301S, n = 7) in the cortex of 5-month old P301S and WT mice. Protein levels were normalized to actin. Data are expressed as percentage of WT. Bars represent the average ± SEM. IRβ, P = 0.06; AKT, P = 0.09; mTOR, P = 0.14; Student t-test
Fig. 2
Fig. 2
Metformin treatment reduces tau phosphorylation in vivo. Total tau and phosphorylated tau (pTau) were analyzed in the cortex and hippocampus of 5 month old P301S mice treated with or without metformin for 4 months. a Western blot of phosphorylated and total tau in the cortex. Actin was analyzed as a loading control. b-g Quantitative analysis of pTau in the cortex (b, d, f, g) and hippocampus (c, e). Phosphorylated tau was analyzed using AT8 (b, c), anti-phospho-S262 tau (d, e), PHF-1 (f), AT270 (g) antibodies and normalized to total tau levels. Total tau was analyzed using Tau5 antibody. Bars represent the average ratio over total tau ± SEM. p < 0.05, Student t-test. Panel b: n = 11 / group. Panel c: Ctr, n = 10; Met, n = 11. Panel d: Ctr, n = 12; Met, n = 12. Panel e: Ctr, n = 7; Met, n = 6; Panel f-g: Ctr, n = 7; Met, n = 7. h-i Representative fluorescence images of AT8 immunoreactivity in the cortex of untreated and metformin-treated P301S mice. Scale bars: in H-I, 50 μm; in h’-i’, 150 μm. Panels h’ and i’ are magnification of squared areas in panels h and i. j. AT8 positive (AT8+) cells in the prefrontal cortex. k-l Representative fluorescence images of AT8 immunoreactivity in hippocampi of untreated and metformin-treated P301S mice. Scale bars: in k-l, 100 μm; in k’-l’, 200 μm. Panels k’ and l’ are magnification of squared areas in panels k and l, respectively. m-o AT8 positive (AT8+) cells in the hippocampus (m), granular zone (n) and dentate gyrus (o). Panel j: Ctr, n = 3; Met, n = 4; Panel m-o: Ctr, n = 3; Met, n = 5. In j and m-o, bars represent the average cell number / mm2 ± SEM. *p < 0.05, **p < 0.01, Student t-test
Fig. 3
Fig. 3
Metformin treatment induces PP2A expression, inhibits mTOR and activates AMPK in the brain of P301S mice. Protein levels of PP2A, GSK3β, pGSK3β, mTOR, S6, phospho-S6 (pS6), AMPK and phospho-AMPK (pAMPK) were analyzed by western blot in the brain of 5 month old P301S mice treated with or without metformin for 4 months. a Western blot of PP2A in the cortex. Tubulin was analyzed as a loading control. b-c Quantitative analysis of PP2A in the cortex (b) and hippocampus (c). In panel b: Ctr, n = 10; Met, n = 12. In panel c: Ctr, n = 9; Met, n = 11. d-e Quantitative analysis of p[S9]GSK3β (d) and GSK3β (e) in the cortex. Ctr, n = 13; Met, n = 12. f Western blot of mTOR in the cortex. Actin was analyzed as a loading control. g Quantitative analysis of mTOR protein expression. Ctr, n = 7; Met, n = 7. h Western blot of pS6 and S6 in the cortex. Tubulin was analyzed as a loading control. i-j Quantitative analysis of pS6 (i) and S6 (j). n = 7 / group. k Western blot of pAMPK and AMPK in the cortex. Tubulin was analyzed as a loading control. l-m Quantitative analysis of AMPK (l) and pAMPK (m). Panel l-m: Ctr, n = 10; Met, n = 12. Protein expression levels were normalized to tubulin or actin as indicated in the graphs. Levels of phosphorylated proteins were normalized to the total respective protein. In all graphs, bars represent the average ratio ± SEM. *p < 0.05, **p < 0.01, Student t-test
Fig. 4
Fig. 4
Metformin reduces tau phosphorylation in mouse cortical neurons via the AMPK-mTOR pathway. Primary cortical neurons were incubated for 6 h with or without 2.5 mM metformin (Met), 10 nM okadaic acid (OA), 10 μM rapamycin (Rapa), and 10 μM dorsomorphin (Dorso) alone or in combination. All treatments were performed in the absence of insulin, except when specifically indicated. a Quantitative analysis of phospho-tau (pTau) in cortical neurons treated with or without metformin in the absence or presence of insulin. b Quantitative analysis of pTau in cortical neurons treated with or without metformin in the absence or presence of okadaic acid. c-d Quantitative analysis of pAMPK (c) and pTau (d) in cortical neurons treated with or without metformin and dorsomorphin alone or in combination. e Quantitative analysis of pS6 in cortical neurons treated with or without metformin in the absence or presence of insulin. f-g. Quantitative analysis of pTau (f) and pS6 (g) in cortical neurons treated with or without metformin and rapamycin. h-i. Quantitative analysis of pS6 (h) and pTau (i) in neurons non-infected (NI), infected with GFP and S16H-Rheb or GFP alone and treated with metformin. Levels of phosphorylated protein were normalized to levels of respective proteins. In panels a, b, d, f, and i, pTau and total tau were analyzed using AT8 and Tau5 antibodies, respectively. In all graphs, bars represent the average ratio ± SEM of 3 independent experiments. *p < 0.05, **p < 0.01, one-way ANOVA followed by Holm-Sidak multiple comparison test
Fig. 5
Fig. 5
Metformin increases the number of tau inclusions in P301S mouse brain in vivo and induces aggregation of recombinant P301S tau in vitro. a Western blot analysis of tau in the sarkosyl-insoluble cortical fraction from P301S mice treated with or without metformin. The arrow indicates the bands of tau dimers. Tau was detected using the phosphorylation-and conformation dependent AT100 and Tau5 anti-tau monoclonal antibodies. MemCode was used to control equal loading. b-c Quantitative analysis of monomeric (b) and dimeric (c) tau in sarkosyl-insoluble fractions of P301S cortex. Densitometric values of tau bands are normalized over MemCode and bars represent the average ratio ± SEM. P301S, n = 4 / group. d. Representative images of MC1 immunoreactivity (d, d’; green) and FSB (d, d”; light blue) fluorescence in the cortex of P301S mice. Scale bars: in d, 50 μm; in d’-d”, 100 μm. e Representative images of AT8 immunoreactivity (e, e’; green) and FSB (e, e”; light blue) fluorescence in the cortex of P301S mice. Scale bars: in e, 50 μm; in e’-e”, 150 μm. f-g FSB+ cells in the prefrontal cortex (f) and hippocampus (g) of P301S mice. n = 3 / group. Bars represent the average number of FSB+ cells / mm2 ± SEM. **p < 0.01, Student t-test. h-i. Gallyas silver staining in the cortex of P301S mice untreated (h) or treated with metformin (i). Scale bar 150 μm. j-k. Gallyas+ cells in the prefrontal cortex (j) and hippocampus (k) of P301S mice. n = 3 / group. Bars represent the average number of Gallyas+ cells / mm2 ± SEM. **p < 0.01, Student t-test. l. Thioflavin T (ThT) fluorescence of recombinant P301S mutant human tau (P301Stau) aggregated in vitro in the absence (Ctr) or presence of 37.5 μM heparin (Hep) and/or 30 μM metformin (Met) for 2, 7 and 14 days. Data points represent the average ± SEM from at least 3 independent experiments. m-n. Representative negative staining electron microscopy image of fibrils of recombinant P301Stau aggregated in vitro for 7 days in presence of heparin (m) or metformin (n). In m, inset shows a high magnification of the squared area. In n, inset shows a high magnification image of tau aggregates. Scale bars: i-j, 2.5 μm; insets, 0.5 μm. o ThT fluorescence of recombinant P301Stau aggregated in vitro in the absence (control, Ctr) or presence of 37.5 μM heparin, 30 μM metformin, 30 μM phenformin (Phe) or 30 μM buformin (Buf) for 7 days. Fluorescence values are expressed as arbitrary units and normalized to the control. Bars represent the average ± SEM. **p < 0.01, one-way ANOVA followed by Holm-Sidak multiple comparison test. p Quantitative analysis of pTau in cortical neurons treated with or without 2.5 mM metformin, 30 μM phenformin and 30 μM buformin. pTau was detected using the AT8 monoclonal antibody and normalized on total tau detected by Tau5 antibody. Data are expressed as percentage of Ctr. Bars represent the average percentage ± SEM from 2 independent experiments. *p < 0.05, **p < 0.01, one-way ANOVA followed by Holm-Sidak multiple comparison test
Figure 6
Figure 6
Metformin worsens hindlimb atrophy and hyperactive behavior and induces caspase 3 activation and tau cleavage. a-c Open field test in 5-month old P301S transgenic mice and age-matched WT non transgenic mice. Distance travelled (a), speed (b) and number of rearings (c) are shown. Bars represent the average values ± SEM. *p < 0.05, Student t-test. n = 9 / group. d-g, k-s. P301S mice were treated with or without metformin (Met) for 4 months starting from 1 month of age. d-f. Open field test. Distance travelled (d), speed (e) and rearing (f) are shown. Bars represent the average values ± SEM. *p < 0.05, Student t-test. Panels d-f: Ctr, n = 11; Met, n = 9. g Hind limb extension test in P301S mice treated with or without metformin. Data points represent the average score ± SEM. *p < 0.05, two-way ANOVA followed by Holm-Sidak multiple comparison test. A.U., arbitrary units. Ctr, n = 12; Met, n = 13. h-j. Primary cortical neurons were treated with or without 0.5 mM metformin for 24 h. h-i. Western blot (h) and quantitative analyses (i) of cleaved caspase 3 (c-caspase 3), c-Tau, c-PARP and PSD95. Protein levels were normalized to actin. Bars represent the average values ± SEM. *p < 0.05, **p < 0.01, Student t-test. n = 3/group. j. Quantification of clusters with overlapping synapsin-I and PSD95 immunoreactivity. Bars represent the average ± SEM. **p < 0.01, Student t-test. n = 11/group. k Representative confocal maximal projection images of active c-caspase 3 immunoreactivity (green) in the prefrontal cortex of untreated and metformin-treated P301S mice. Nuclei are counterstained with Hoechst 33342. Scale bar 10 μm. l Quantitative analysis of active c-caspase 3. c-caspase 3 was analyzed by western blot and protein levels were normalized to tubulin. Bars represent the average ± SEM. n = 7 / group. *p < 0.05, Student t-test. m Western blot analysis of cleaved-tau (c-Tau) in the soluble and sarkosyl-insoluble fraction of metformin-treated and untreated P301S mouse cortex. n-o Quantitative analysis of cleaved Tau (c-Tau) in the soluble (n) and insoluble (o) cortical fraction. c-Tau was analyzed by western blot and protein levels were normalized to actin (n) or MemCode (o). Bars represent the average ± SEM. Panel n: n = 7 / group. Panel o: n = 3/group. p Western blot analysis of synapsin I, PSD95, synaptophysin, tubulin and GAPDH in the cortex of P301S mice treated with or without metformin. q-s. Quantitative analysis of synapsin I (q), PSD95 (r) and synaptophysin (s). Protein levels were analyzed by western bot and normalized to tubulin or GAPDH. Bars represent the average ± SEM. *p < 0.05, Student t-test. Panel q: n = 7 / group. Panel r: Ctr, n = 13; Met, n = 10. Panel s: Ctr, n = 13; Met, n = 11

References

    1. Bateman RJ, Xiong C, Benzinger TL, Fagan AM, Goate A, Fox NC, et al. Clinical and biomarker changes in dominantly inherited Alzheimer’s disease. N Engl J Med. 2012;367:795–804. doi: 10.1056/NEJMoa1202753. - DOI - PMC - PubMed
    1. Arriagada PV, Growdon JH, Hedley-Whyte ET, Hyman BT. Neurofibrillary tangles but not senile plaques parallel duration and severity of Alzheimer’s disease. Neurology. 1992;42:631–9. doi: 10.1212/WNL.42.3.631. - DOI - PubMed
    1. Gasparini L, Netzer WJ, Greengard P, Xu H. Does insulin dysfunction play a role in Alzheimer’s disease? Trends Pharmacol Sci. 2002;23:288–93. doi: 10.1016/S0165-6147(02)02037-0. - DOI - PubMed
    1. El Khoury NB, Gratuze M, Papon MA, Bretteville A, Planel E. Insulin dysfunction and Tau pathology. Front Cell Neurosci. 2014;8:22. doi: 10.3389/fncel.2014.00022. - DOI - PMC - PubMed
    1. Cohen AD, Klunk WE. Early detection of Alzheimer’s disease using PiB and FDG PET. Neurobiol Dis. 2014;72 Pt A:117–22. doi: 10.1016/j.nbd.2014.05.001. - DOI - PMC - PubMed

Publication types