. 2016 Feb 9:5:e12620.
doi: 10.7554/eLife.12620.

Cyanobacteria use micro-optics to sense light direction

Affiliations

Cyanobacteria use micro-optics to sense light direction

Nils Schuergers et al. Elife. .

Abstract

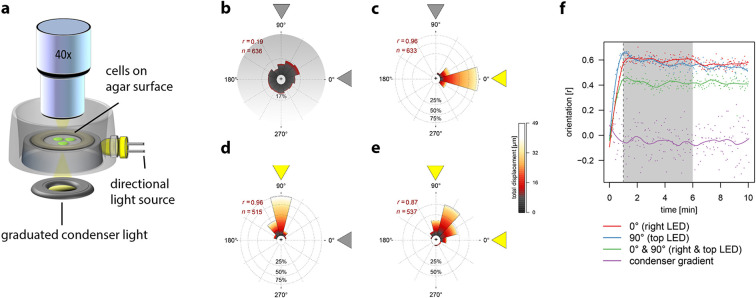
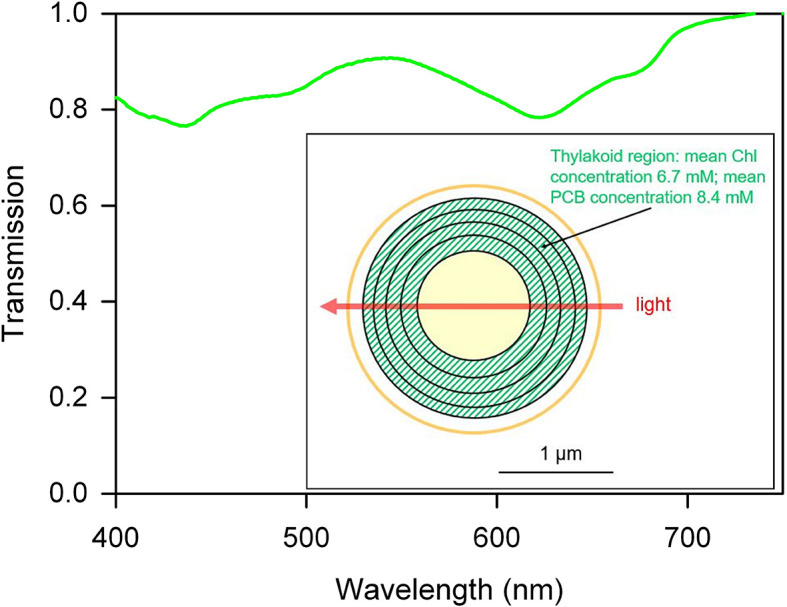
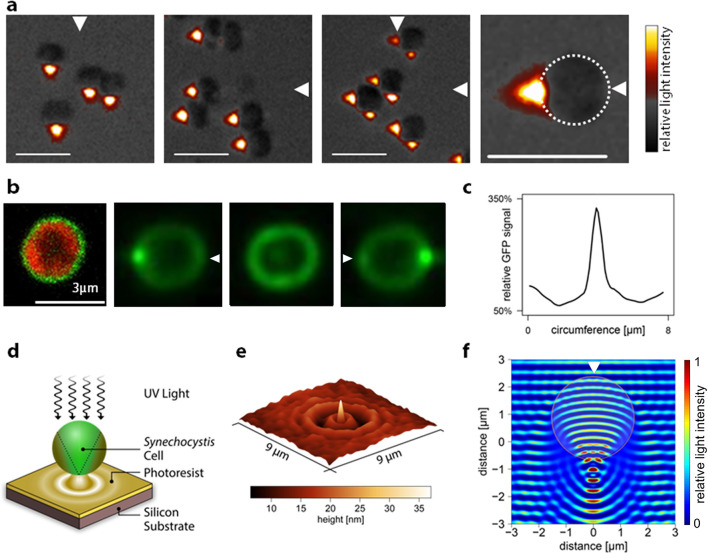
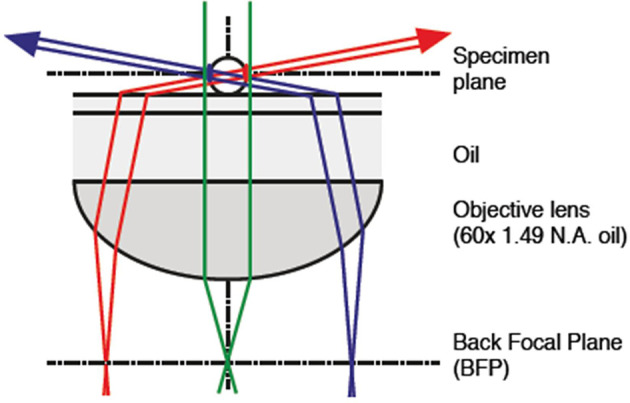
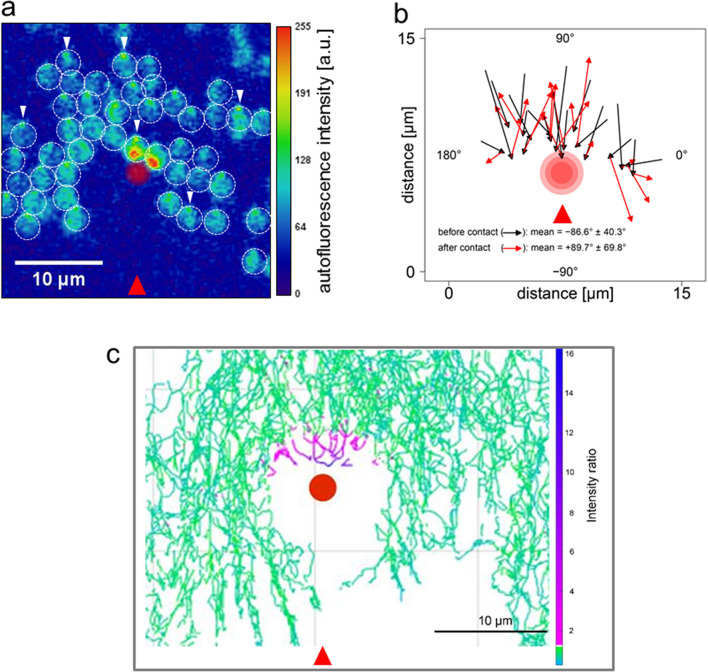
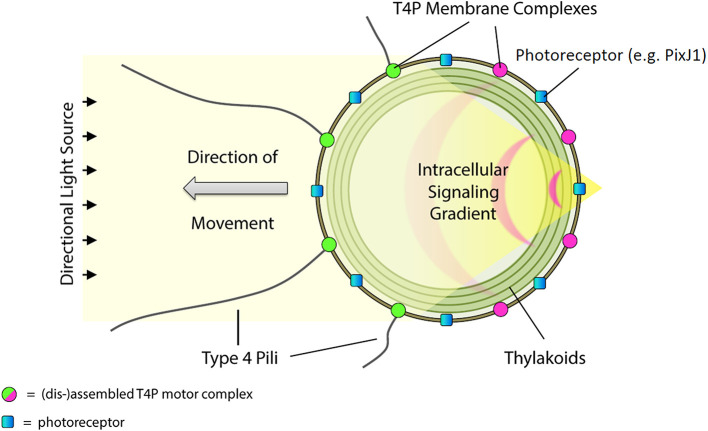
Bacterial phototaxis was first recognized over a century ago, but the method by which such small cells can sense the direction of illumination has remained puzzling. The unicellular cyanobacterium Synechocystis sp. PCC 6803 moves with Type IV pili and measures light intensity and color with a range of photoreceptors. Here, we show that individual Synechocystis cells do not respond to a spatiotemporal gradient in light intensity, but rather they directly and accurately sense the position of a light source. We show that directional light sensing is possible because Synechocystis cells act as spherical microlenses, allowing the cell to see a light source and move towards it. A high-resolution image of the light source is focused on the edge of the cell opposite to the source, triggering movement away from the focused spot. Spherical cyanobacteria are probably the world's smallest and oldest example of a camera eye.

Keywords: Cyanobacteria; Micro-optics; Phototaxis; Signal transduction; Synechocystis sp PCC6803; Thermosynechococcus elongatus; biophysics; infectious disease; microbiology; structural biology.

Plain language summary

Cyanobacteria are blue-green bacteria that are abundant in the environment. Cyanobacteria in the oceans are among the world’s most important oxygen producers and carbon dioxide consumers. Synechocystis is a spherical single-celled cyanobacterium that measures about three thousandths of a millimetre across. Because Synechocystis needs sunlight to produce energy, it is important for it to find places where the light is neither too weak nor too strong. Unlike some bacteria, Synechocystis can’t swim, but it can crawl across surfaces. It uses this ability to move to places where the light conditions are better. It was already known that Synechocystis cells move towards a light source that is shone at them from one side, which implies that the cyanobacteria can “see” where the light is. But how can such a tiny cell accurately detect where light is coming from? Schuergers et al. tracked how Synechocystis moved in response to different light conditions, and found that the secret of “vision” in these cyanobacteria is that the cells act as tiny spherical lenses. When a light is shone at the cell, an image of the light source is focused at the opposite edge of the cell. Light-detecting molecules called photoreceptors respond to the focused image of the light source, and this provides the information needed to steer the cell towards the light. Although the details are different, and although a Synechocystis cell is in terms of volume about 500 billion times smaller than a human eyeball, vision in Synechocystis actually works by principles similar to vision in humans. Schuergers et al.’s findings open plenty of further questions, as other types of bacteria may also act as tiny lenses. More also remains to be learnt about how the cyanobacteria process visual information.


Conflict of interest statement

The authors declare that no competing interests exist.

Figures

Figure 1.
Figure 1.. Movement of individual Synechocystis cells under different light regimes.
Displacement over a 5 min time-frame was measured 1 min after the onset of illumination. The mean resultant length from a Rayleigh test (r) and the number of tracked cells (n) are shown. See also Video 1. All data were obtained with the same cells from a single continuous experiment. (a) Schematic diagram to illustrate the optical set-up for a light gradient projected onto the agar surface (as in b) and oblique directional illumination (as in c–e). (b) Cells moving in a white light gradient from 0–20 µmol photons m–2 s–1 over a 165 µm interval from the top to the bottom of the plot, showing no significant directional bias. (c) Illumination from an oblique RGB LED light source from the right, at intensity 10 µmol photons m–2 s–1. (d) Illumination from a similar light source placed orthogonally to that in (b). (e) Simultaneous illumination from both oblique light sources. (f) Correlation of cell movement with light direction, as a function of time after applying the light. The shading indicates the time window plotted in b–e. The y-axis shows the mean resultant length from a Rayleigh test (r) where 0 indicates random displacements and 1 indicates maximal clustering in the direction of illumination. LED, light emitting diode. DOI: http://dx.doi.org/10.7554/eLife.12620.003
Figure 2.
Figure 2.. Estimated transmission spectrum of a single motile Synechocystis cell.
Estimate obtained by scaling and converting the absorption spectrum for a suspension of cells from a moving Synechocystis colony, as detailed in Materials and methods. Pigments (including chlorophyll: Chl and phycocyanin-coupled phycocyanobilin: PCB) are assumed to be evenly distributed within the thylakoid region as shown in the diagram, and the estimated transmission is for a narrow beam of light passing straight through the center of the cell, with an optical path length through the thylakoid region of 1 μm. The spectrum represents a minimum estimate for transmission through the cell, since the estimate assumes a homogeneous distribution of pigments within the thylakoid region. In reality, inhomogeneous distribution of membranes and pigments will tend to decrease absorption due to enhanced self-shading (Duysens, 1956). DOI: http://dx.doi.org/10.7554/eLife.12620.005
Figure 3.
Figure 3.. Micro-optic effects in cyanobacteria.
(a) Synechocystis cells viewed with oblique illumination from the different directions shown, with enlarged image on the right. Scale-bars: 5 µm. (b) Images of periplasmic GFP fluorescence in Synechocystis torA-gfp (Spence et al., 2003). Left: two-channel confocal micrograph (GFP fluorescence in green; chlorophyll fluorescence in red) with GFP epifluorescence images of a single cell illuminated from the right, above and left (arrows indicate illumination direction; see Figure 3—figure supplement 1 for the optical set-up). (c) GFP fluorescence profile around the cell circumference, extracted from the epifluorescence image in (b) with illumination from the right. The profile was taken in an anti-clockwise direction starting at the point nearest the light source. (d) Schematic illustration of the measurement by photolithography of near-field optical effects of a Synechocystis cell. (e) Height profile reconstructed from an AFM image of a photolithograph from the experiment illustrated in (d). (f) Finite difference time domain model of the light path (wavelength 365 nm) through a Synechocystis cell (illumination direction indicated by the arrow). The color scale indicates relative light intensity obtained by time-averaging the amplitude of the Poynting vector for the electromagnetic field. The wave patterns represent a snapshot of the oscillating electromagnetic field propagating through the model cell. GFP, green fluorescent protein. DOI: http://dx.doi.org/10.7554/eLife.12620.006
Figure 3—figure supplement 1.
Figure 3—figure supplement 1.. Optical set-up for oblique-angle excitation fluorescence microscopy to visualize periplasmic GFP fluorescence (Figure 3c).
Fluorescence excitation was achieved by near-total internal reflection fluorescence (TIRF) (“highly inclined”/“oblique”) illumination of the samples, with fiber-coupled 488 nm laser light injected into the epifluorescence port of the microscope via the dichroic mirror. The fiber, collimator, quarter-wave plate and total internal reflection (TIR)-lens were mounted on a translation stage and positioned such that the focused beam was centered at the BFP of the Olympus 100x objective lens. By adjusting the translation stage, the position of the beam could be translated across the BFP to adjust the inclination angle of the beam through the sample. Images were captured using a GFP filter set. BFP, back focal plane; GFP, green fluorescent protein. DOI: http://dx.doi.org/10.7554/eLife.12620.007
Figure 4.
Figure 4.. Direction switching triggered by specific excitation of one edge of the cell.
Synechocystis cells were moving in response to an oblique 625 nm light source from the direction indicated by the red arrows and allowed to encounter a spot of 640 nm laser light focused on the agarose surface. See Video 2 for the full data and Figure 4—figure supplement 1 for the optical set-up and the intensity profile of the laser spot. (a) False color image of fluorescence from the photosynthetic pigments, with the laser spot indicated by the red circle. The broken white lines indicate the approximate cell boundaries and the white arrows highlight examples of the focused images of the light source at the rear edge of the cell. Cells approaching the laser spot show strong selective excitation of the leading edge of the cell. (b) Direction switching triggered by contact with the edge of the laser spot. The arrowed lines indicate net displacements of representative cells over time windows of 132 s before and after closest approach to the laser spot. The mean orientation of the tracks ( ± standard deviation, n = 29) is shown. (c) Light intensity required to reverse the path of Synechocystis cells. Tracks of the mid-points of individual cells are shown over a 30 min time window, with a color scale indicating the ratio of laser intensity to the intensity of the phototactic LED light focused on the cell. Purple color indicates tracks of cells in which autofluorescence induced by the laser exceeds autofluorescence induced by the light focused on the cell for phototaxis by at least two-fold. LED, light emitting diode DOI: http://dx.doi.org/10.7554/eLife.12620.009
Figure 4—figure supplement 1.
Figure 4—figure supplement 1.. Optical set-up used to measure the response of Synechocystis cells to a highly focused laser light spot (Figure 4; Video 2).
(a) The time lapse microscope was constructed on the base of an Olympus IX81 microscope, using a 40x× objective lens (Air, NA 0.75). Two air-cooled electron-multiplying charge-coupled device (EMCCD) cameras were coupled to the camera port of the microscope via a magnifying relay. The cameras were simultaneously triggered using a TTL (transistor-transistor logic) pulse from an external digital-to-analog converter, with an exposure time of 50 ms and a frequency of 0.25 Hz. A dichroic mirror in the Fourier plane of the camera relay split the emission into red (fluorescence) and green (transmission bright-field imaging) channels. Each channel had a separate band pass filter. The focused laser spot was generated by expanding a collimated beam from a fiber-coupled continuous wave (CW) diode laser, injected via the epifluorescence port of the microscope and directed to the objective lens via a dichroic filter. The beam was expanded to overfill the back aperture of the objective lens to achieve a diffraction-limited spot at the focal plane. A combination of neutral density filters and a half-wave plate and polarizing beam splitter were used to adjust the power of the laser to approximately 0.01 μW. A 1:1 lens pair with one lens mounted on a Z-translation stage was used to adjust the axial position of the focus at the sample plane. A quarter-wave plate was used to circularly polarize the beam before it was injected into the microscope. The laser intensity profile is shown in (b). Bright-field trans-illumination was performed by fiber-coupling a 530 nm LED into a multimode fiber and imaging the magnified end of the fiber at the sample plane using a condenser lens. The LED was TTL triggered from via the camera acquisition to reduce light exposure to the cells, resulting in a synchronized 50 ms pulse during acquisition. A third LED (625 nm, 3 mW) was mounted close to the sample at an oblique angle to provide directional illumination for the motility assay. LED, light emitting diode. DOI: http://dx.doi.org/10.7554/eLife.12620.010
Figure 5.
Figure 5.. Model for control of positive phototaxis in Synechocystis.
Directional illumination of the cell produces a sharply focused and intense spot of light (resembling a photonic nanojet) at the cell periphery on the opposite side from the light source. The focused spot is perceived by photoreceptors in the cytoplasmic membrane (for example PixJ1) triggering signal transduction via CheY-like response regulators that locally inactivates the T4P motility apparatus, dispersing T4P components including the extension motor PilB1. Consequently, patches of the motor proteins can only form on the side of the cell facing the light source. Pili are extended and retracted at this side of the cell, which therefore moves towards the light. T4P, Type IV pili. DOI: http://dx.doi.org/10.7554/eLife.12620.011

Comment in

Similar articles

Cited by

References

    1. Agostinelli C, Lund U. R package “circular”: circular statistics (version 0.4-7). at. 2013. https://r-forge.r-project.org/projects/circular/ https://r-forge.r-project.org/projects/circular/
    1. Alam M, Oesterhelt D. Morphology, function and isolation of halobacterial flagella. Journal of Molecular Biology. 1984;176:459–475. - PubMed
    1. Berg HC, Brown DA. Chemotaxis in Escherichia coli analysed by three-dimensional tracking. Nature. 1972;239:500–504. - PubMed
    1. Bhaya D, Bianco NR, Bryant D, Grossman A. Type IV pilus biogenesis and motility in the cyanobacterium Synechocystis sp. PCC6803. Molecular Microbiology. 2000;37:941–951. - PubMed
    1. Bhaya D, Nakasugi K, Fazeli F, Burriesci MS. Phototaxis and impaired motility in adenylyl cyclase and cyclase receptor protein mutants of Synechocystis sp. strain PCC 6803. Journal of Bacteriology. 2006;188:7306–7310. doi: 10.1128/JB.00573-06. - DOI - PMC - PubMed