. 2016 Apr 1;291(14):7767-73.
doi: 10.1074/jbc.M115.695122. Epub 2016 Feb 8.

Inhibition of the Formation of the Spf1p Phosphoenzyme by Ca2

Affiliations

Inhibition of the Formation of the Spf1p Phosphoenzyme by Ca2

Gerardo R Corradi et al. J Biol Chem. .

Abstract

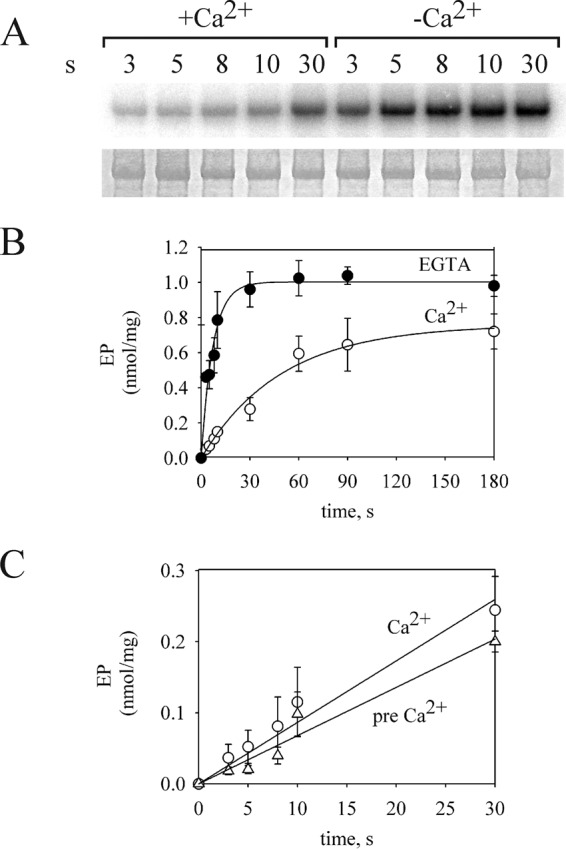
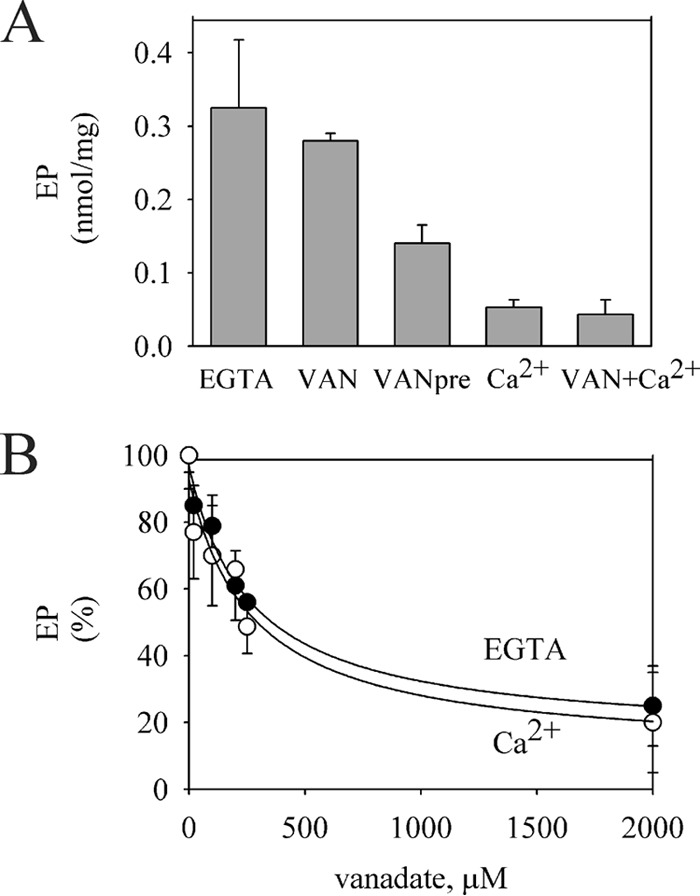
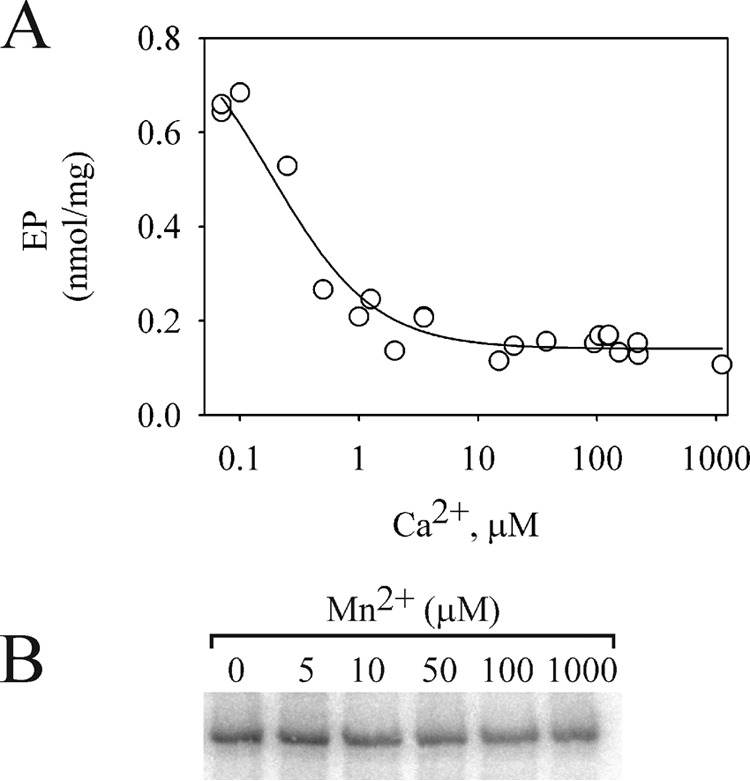
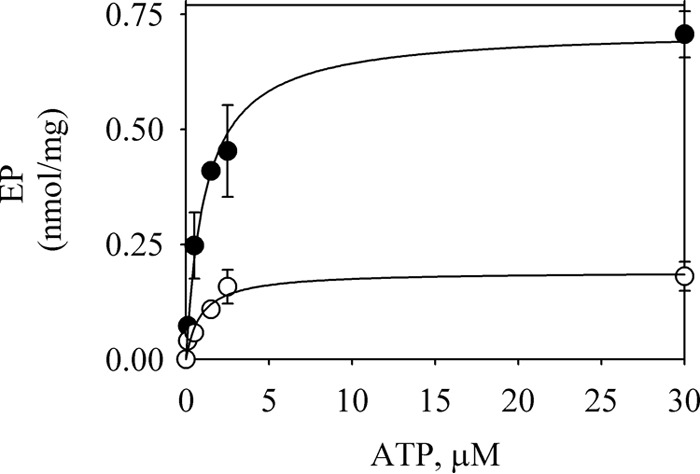
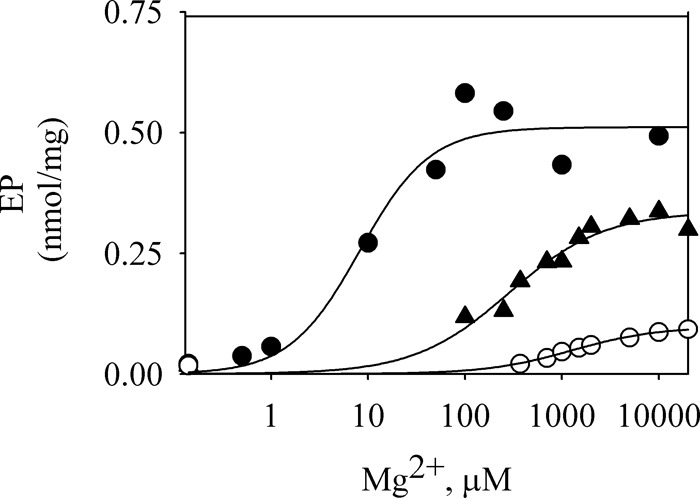
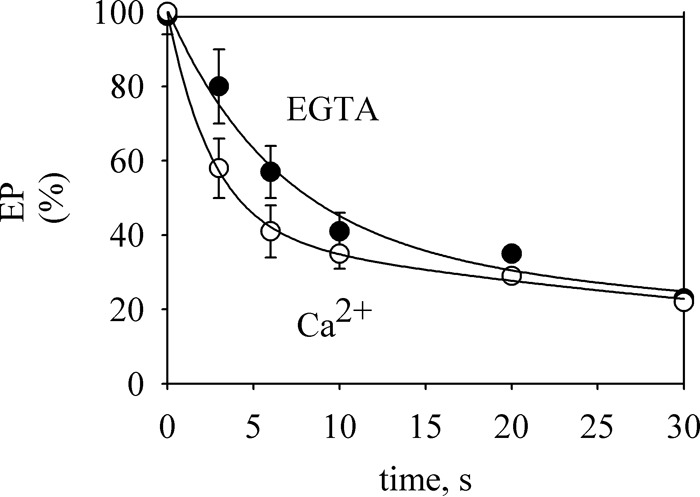
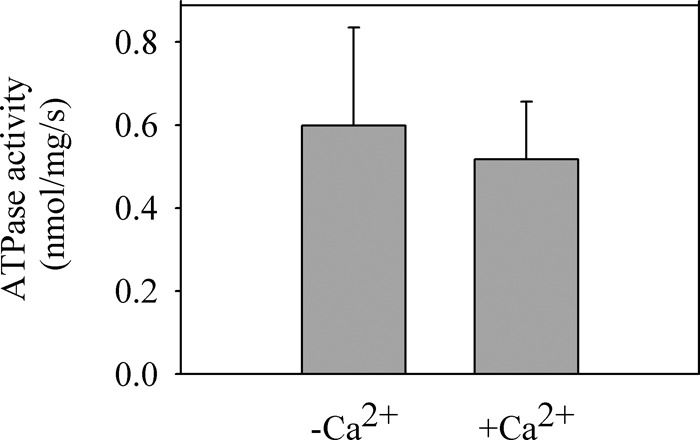
P5-ATPases are important for processes associated with the endosomal-lysosomal system of eukaryotic cells. In humans, the loss of function of P5-ATPases causes neurodegeneration. In the yeastSaccharomyces cerevisiae, deletion of P5-ATPase Spf1p gives rise to endoplasmic reticulum stress. The reaction cycle of P5-ATPases is poorly characterized. Here, we showed that the formation of the Spf1p catalytic phosphoenzyme was fast in a reaction medium containing ATP, Mg(2+), and EGTA. Low concentrations of Ca(2+)in the phosphorylation medium decreased the rate of phosphorylation and the maximal level of phosphoenzyme. Neither Mn(2+)nor Mg(2+)had an inhibitory effect on the formation of the phosphoenzyme similar to that of Ca(2+) TheKmfor ATP in the phosphorylation reaction was ∼1 μmand did not significantly change in the presence of Ca(2+) Half-maximal phosphorylation was attained at 8 μmMg(2+), but higher concentrations partially protected from Ca(2+)inhibition. In conditions similar to those used for phosphorylation, Ca(2+)had a small effect accelerating dephosphorylation and minimally affected ATPase activity, suggesting that the formation of the phosphoenzyme was not the limiting step of the ATP hydrolytic cycle.

Keywords: ATPase; P-ATPase; P5-ATPase; ion pump; phosphoryl transfer; phosphorylation; protein phosphorylation; transporter.


Figures

FIGURE 1.
FIGURE 1.
Time course of EP formation. A, acidic gel electrophoresis of phosphorylated GFP-Spf1p showing the radioactivity (top panel) or the Coomassie Blue staining (bottom panel). 1.5 μg of GFP-Spf1p was suspended at 4 °C in a medium containing 2 mm Mg2+ and 0.5 mm EGTA. The reaction was started by adding 0.5 μm ATP plus 0.5 mm EGTA or 0.5 μm ATP plus enough CaCl2 to give a final concentration of 100 μm Ca2+. B, EP levels quantified as described under “Experimental Procedures.” The data points are the averages from three experiments. Error bars show the standard deviation. ●, 0.5 mm EGTA; ○, 100 μm Ca2+. The data were fitted by an exponential equation with the following parameters, in the absence of Ca2+ EPmax = 1.00 + 0.03 nmol/mg, and kp = 0.14 + 0.01 s−1, and in the presence of Ca2+, EPmax = 0.75 + 0.04 nmol/mg, and kp = 0.020 + 0.002 s−1. C, the phosphorylation was done in conditions similar to B except that either the enzyme was suspended in a reaction medium with 0.5 mm EGTA, and Ca2+ was added together with ATP (circles), or the enzyme was preincubated in a reaction medium with Ca2+ for 5 min at 4 °C before starting the phosphorylation (triangles). The data points are the averages from two experiments. Error bars show the standard deviation.
FIGURE 2.
FIGURE 2.
Comparison of the effects of Ca2+ and vanadate on the EP formation. A, 1.5 μg of GFP-Spf1p was suspended at 4 °C in a medium containing 2 mm Mg2+ and 0.5 mm EGTA, and the phosphorylation was started by adding 0.5 μm ATP (EGTA); 0.5 μm ATP plus 200 μm vanadate (VAN); 0.5 μm ATP plus 100 μm Ca2+ (Ca2+); or 0.5 μm ATP, 200 μm vanadate, and 100 μm Ca2+ (VAN+Ca2+). The bar (VANpre) shows the level of EP formed in conditions similar to (VAN) except that the enzyme was preincubated for 5 min at 4 °C with 200 μm vanadate before starting the phosphorylation. The reaction time was 5 s. The values are the average from two experiments. Error bars show the standard deviation. B, GFP-Spf1p was suspended at 4 °C in a medium containing 2 mm Mg2+ and 0.5 mm EGTA and the indicated concentration of vanadate. The phosphorylation was started by adding 0.5 μm ATP (filled circles) or 0.5 μm ATP plus 100 μm Ca2+ (empty circles). The value of EP in each condition in the absence of vanadate was taken as 100%. The data points are the averages from three experiments, and the error bars show the standard deviation. The lines represents the best fit to the data given by the hyperbolic equation EP = EP0 + EPm[vanadate]/(Ki + [vanadate]), with the following parameters, in the absence of Ca2+, EP0 = 15 ± 7%, Ki = 267 ± 75 μm and EPm = 81 ± 7% and in 100 μm Ca2+, EP0 = 10 ± 13%, Ki = 274 ± 144 μm, and EPm = 82 ± 14%.
FIGURE 3.
FIGURE 3.
Dependence of the EP formation with the concentration of Ca2+ and Mn2+. A, 1.5 μg of GFP-Spf1p was suspended at 4 °C in a medium containing 2 mm Mg2+ 0.5 mm EGTA and increasing concentrations of CaCl2 to give the indicated concentrations of Ca2+ in the final reaction medium. The reaction was started by adding 30 μm ATP and terminated after 5 s. The data points shown are measurements from three independent experiments. The line represents the best fit to the data given by the hyperbolic equation EP = EP0 + EPCa [Ca]/(Ki + [Ca]), with the following parameters EP0 = 0.14 ± 0.01 nmol/mg, Ki = 0.18 ± 0.04 μm, and EPCa = 0.74 ± 0.06 nmol/mg. B, GFP-Spf1p was suspended at 4 °C in a medium containing 2 mm Mg2+ and the indicated concentrations of Mn2+ and phosphorylated by the addition of 30 μm ATP.
FIGURE 4.
FIGURE 4.
ATP dependence of EP formation. 1.5 μg of GFP-Spf1p was suspended at 4 °C in a medium containing 2 mm Mg2+, 0.5 mm EGTA, and the phosphorylation was started by adding ATP (filled circles) or ATP plus CaCl2 to give 100 μm Ca2+ (empty circles). The reaction time was 5 s. The concentrations of ATP indicated correspond to the final concentration in the reaction medium. The data points are the averages from two experiments, and the error bars show the standard deviation. The lines represent the best fit to the data given by a hyperbolic equation with EP = EPmax5 [ATP]/(Km + [Ca2+]) with the following parameters: without Ca2+, EPmax5 = 0.72 ± 0.03 nmol/mg, Km = 1.1 ± 0.1 μm, with Ca2+, EPmax5 = 0.19 ± 0.01 nmol/mg, and Km = 0.9 ± 0.3 μm.
FIGURE 5.
FIGURE 5.
Mg2+ dependence of EP formation. 1.5 μg of GFP-Spf1p was suspended at 4 °C in a medium containing 0.5 mm EGTA and enough MgCl2 to give the indicated final Mg2+ concentrations in the phosphorylation medium. The phosphorylation was started by adding 30 μm ATP (filled circles), 30 μm ATP plus 0.2 μm Ca2+ (filled triangles), or 30 μm ATP plus 100 μm Ca2+ (empty circles). The reaction time was 5 s. The data points shown are measurements from five independent experiments. The lines represent the best fit to the data given by the Hill equation. The estimated values of KMg were 8, 280, and 1250 μm for no Ca2+, 0.2 μm Ca2+, and 100 μm Ca2+, respectively.
FIGURE 6.
FIGURE 6.
Time course of EP decay. GFP-Spf1p was phosphorylated for 60 s at 4 °C in a medium containing 2 mm Mg2+, 0.5 mm EGTA, and 0.5 μm ATP, and the dephosphorylation was measured after diluting the radioactive label with 500 μm of cold ATP or 500 μm of cold ATP plus enough CaCl2 to give 100 μm Ca2+. The lines represent the best fit to the data given by an equation of double exponential decay. The data points are the averages from two experiments. Error bars show the standard deviation.
FIGURE 7.
FIGURE 7.
Effect of Ca2+ on the ATPase activity. The ATPase activity of GFP-Spf1p was measured as described under “Experimental Procedures” at 28 °C for 20 s in a reaction medium containing 30 μm ATP, 2 mm Mg2+, 0.5 mm EGTA with (+Ca), or without (−Ca) CaCl2 to give 100 μm Ca2+. The data points are the averages from three experiments. Error bars show the standard deviation.

Similar articles

Cited by

References

    1. Palmgren M. G., Axelsen K. B. (1998) Evolution of P-type ATPases. Biochim. Biophys. Acta 1365, 37–45 - PubMed
    1. Sørensen D. M., Buch-Pedersen M. J., and Palmgren M. G. (2010) Structural divergence between the two subgroups of P5 ATPases. Biochim. Biophys. Acta 1797, 846–855 - PubMed
    1. van Veen S., Sørensen D. M., Holemans T., Holen H. W., Palmgren M. G., and Vangheluwe P. (2014) Cellular function and pathological role of ATP13A2 and related P-type transport ATPases in Parkinson's disease and other neurological disorders. Front. Mol. Neurosci. 7, 48. - PMC - PubMed
    1. Perrett R. M., Alexopoulou Z., and Tofaris G. K. (2015) The endosomal pathway in Parkinson's disease. Mol. Cell Neurosci. 66, 21–28 - PubMed
    1. Suzuki C., and Shimma Y. I. (1999) P-type ATPase Spf1 mutants show a novel resistance mechanism for the killer toxin SMKT. Mol. Microbiol. 32, 813–823 - PubMed

Publication types

MeSH terms

Substances

LinkOut - more resources