Inhibitor of Differentiation/DNA Binding 1 (ID1) Inhibits Etoposide-induced Apoptosis in a c-Jun/c-Fos-dependent Manner
- PMID: 26858249
- PMCID: PMC4807270
- DOI: 10.1074/jbc.M115.704361
Inhibitor of Differentiation/DNA Binding 1 (ID1) Inhibits Etoposide-induced Apoptosis in a c-Jun/c-Fos-dependent Manner
Abstract
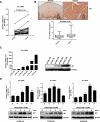
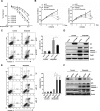
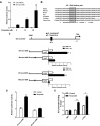
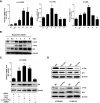
ID1 (inhibitor of differentiation/DNA binding 1) acts an important role in metastasis, tumorigenesis, and maintenance of cell viability. It has been shown that the up-regulation of ID1 is correlated with poor prognosis and the resistance to chemotherapy of human cancers. However, the underlying molecular mechanism remains elusive. Here, we determined for the first time that up-regulating ID1 upon etoposide activation was mediated through AP-1 binding sites within theID1promoter and confirmed that ID1 enhanced cell resistance to DNA damage-induced apoptosis in esophageal squamous cell carcinoma cells. Ablation of c-Jun/c-Fos or ID1 expression enhanced etoposide-mediated apoptosis through increasing activity of caspase 3 and PARP cleavage. Moreover, c-Jun/c-Fos and ID1 were positively correlated in human cancers. More importantly, simultaneous high expression of ID1 and c-Jun or c-Fos was correlated with poor survival in cancer patients. Collectively, we demonstrate the importance of c-Jun/c-Fos-ID1 signaling pathway in chemoresistance of esophageal cancer cells and provide considerable insight into understanding the underlying molecular mechanisms in esophageal squamous cell carcinoma cell biology.
Keywords: AP-1 transcription factor (AP-1); ID1; apoptosis; c-Fos; c-Jun; chemoresistance; etoposide; promoter.
© 2016 by The American Society for Biochemistry and Molecular Biology, Inc.
Figures

Similar articles
-
Competitive Binding Between Id1 and E2F1 to Cdc20 Regulates E2F1 Degradation and Thymidylate Synthase Expression to Promote Esophageal Cancer Chemoresistance.Clin Cancer Res. 2016 Mar 1;22(5):1243-55. doi: 10.1158/1078-0432.CCR-15-1196. Epub 2015 Oct 16. Clin Cancer Res. 2016. PMID: 26475334
-
Acetylcholinesterase expression mediated by c-Jun-NH2-terminal kinase pathway during anticancer drug-induced apoptosis.Oncogene. 2006 Nov 9;25(53):7070-7. doi: 10.1038/sj.onc.1209686. Epub 2006 May 22. Oncogene. 2006. PMID: 16715131
-
AP-1 regulates sphingosine kinase 1 expression in a positive feedback manner in glomerular mesangial cells exposed to high glucose.Cell Signal. 2014 Mar;26(3):629-38. doi: 10.1016/j.cellsig.2013.12.002. Epub 2013 Dec 14. Cell Signal. 2014. PMID: 24342046
-
Inhibitor of Differentiation 1 (Id1) in Cancer and Cancer Therapy.Int J Med Sci. 2020 Apr 6;17(8):995-1005. doi: 10.7150/ijms.42805. eCollection 2020. Int J Med Sci. 2020. PMID: 32410828 Free PMC article. Review.
-
Recent research advances of c-fos in regulating cell senescence.Arch Biochem Biophys. 2025 Jul;769:110423. doi: 10.1016/j.abb.2025.110423. Epub 2025 Apr 15. Arch Biochem Biophys. 2025. PMID: 40246221 Review.
Cited by
-
Utilizing network pharmacology and experimental validation to explore the potential molecular mechanisms of raw Pinellia ternate in treating esophageal cancer.J Gastrointest Oncol. 2023 Oct 31;14(5):2006-2017. doi: 10.21037/jgo-23-684. Epub 2023 Oct 27. J Gastrointest Oncol. 2023. PMID: 37969842 Free PMC article.
-
Exploring the mechanism of ellagic acid against gastric cancer based on bioinformatics analysis and network pharmacology.J Cell Mol Med. 2023 Dec;27(23):3878-3896. doi: 10.1111/jcmm.17967. Epub 2023 Oct 4. J Cell Mol Med. 2023. PMID: 37794689 Free PMC article.
-
Overexpression of miR-216b sensitizes NSCLC cells to cisplatin-induced apoptosis by targeting c-Jun.Oncotarget. 2017 Oct 27;8(61):104206-104215. doi: 10.18632/oncotarget.22171. eCollection 2017 Nov 28. Oncotarget. 2017. PMID: 29262633 Free PMC article.
-
Identification of crucial miRNAs and genes in esophageal squamous cell carcinoma by miRNA-mRNA integrated analysis.Medicine (Baltimore). 2019 Jul;98(27):e16269. doi: 10.1097/MD.0000000000016269. Medicine (Baltimore). 2019. PMID: 31277149 Free PMC article.
-
Involvement of c-Fos in cell proliferation, migration, and invasion in osteosarcoma cells accompanied by altered expression of Wnt2 and Fzd9.PLoS One. 2017 Jun 30;12(6):e0180558. doi: 10.1371/journal.pone.0180558. eCollection 2017. PLoS One. 2017. PMID: 28665975 Free PMC article.
References
-
- Pennathur A., Gibson M. K., Jobe B. A., and Luketich J. D. (2013) Oesophageal carcinoma. Lancet 381, 400–412 - PubMed
-
- Dutton S. J., Ferry D. R., Blazeby J. M., Abbas H., Dahle-Smith A., Mansoor W., Thompson J., Harrison M., Chatterjee A., Falk S., Garcia-Alonso A., Fyfe D. W., Hubner R. A., Gamble T., Peachey L., Davoudianfar M., Pearson S. R., Julier P., Jankowski J., Kerr R., and Petty R. D. (2014) Gefitinib for oesophageal cancer progressing after chemotherapy (COG): a phase 3, multicentre, double-blind, placebo-controlled randomised trial. Lancet Oncol. 15, 894–904 - PubMed
Publication types
MeSH terms
Substances
LinkOut - more resources
Full Text Sources
Other Literature Sources
Medical
Research Materials
Miscellaneous

