. 2016 Feb 15;212(4):425-38.
doi: 10.1083/jcb.201507018. Epub 2016 Feb 8.

Plakophilin-2 loss promotes TGF-β1/p38 MAPK-dependent fibrotic gene expression in cardiomyocytes

Affiliations

Plakophilin-2 loss promotes TGF-β1/p38 MAPK-dependent fibrotic gene expression in cardiomyocytes

Adi D Dubash et al. J Cell Biol. .

Abstract

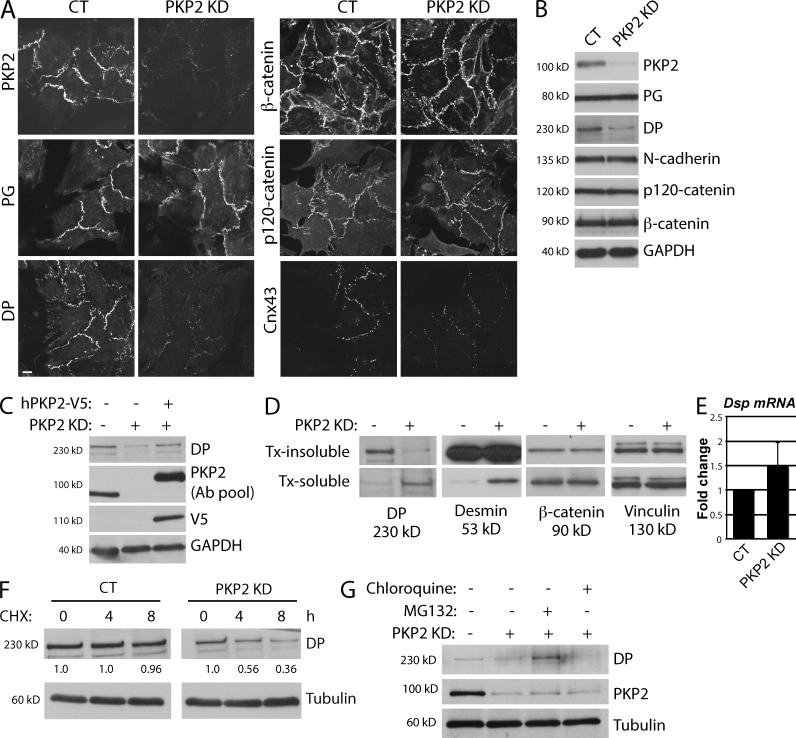
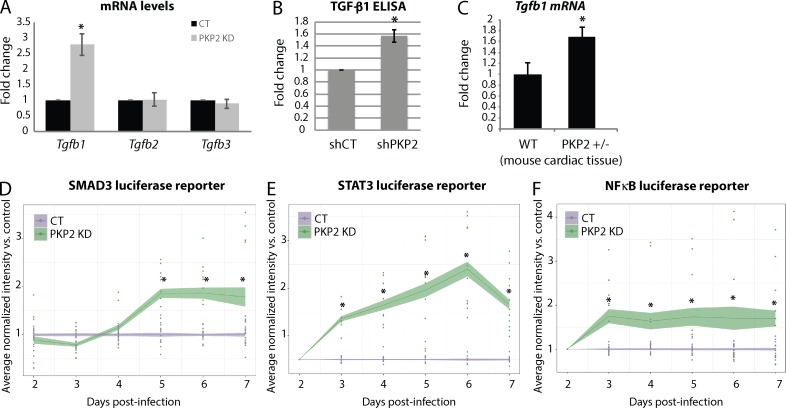
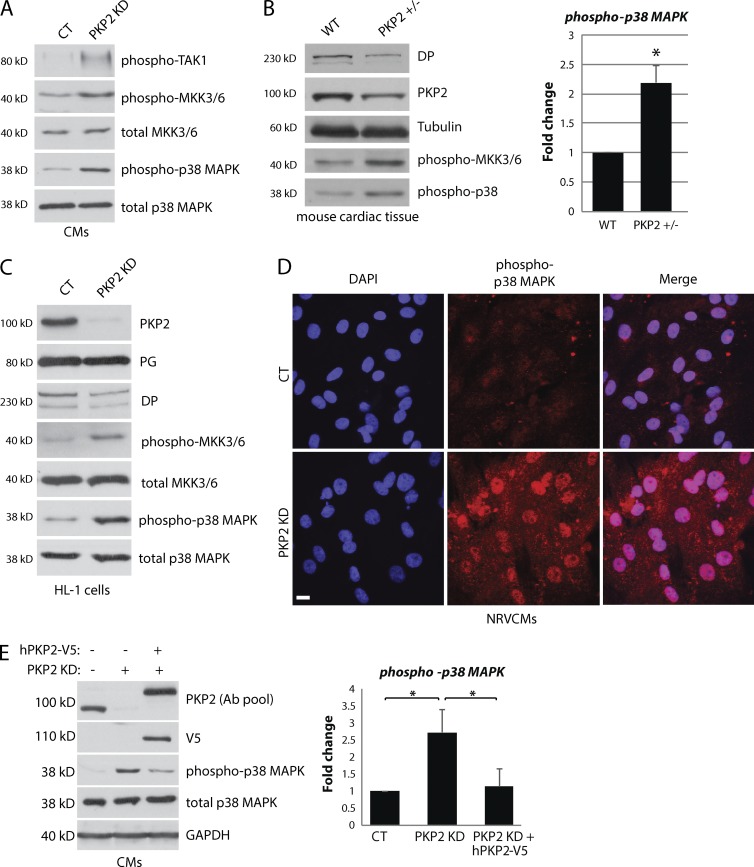
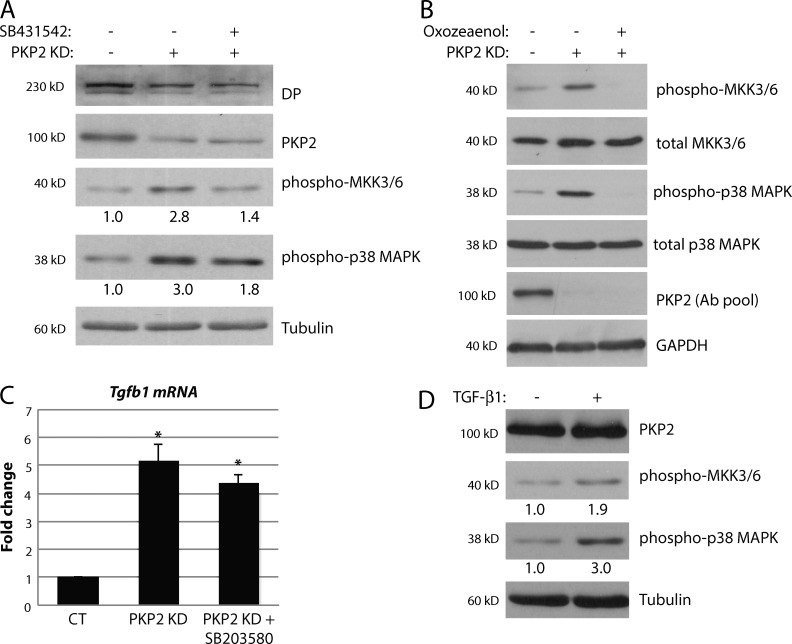
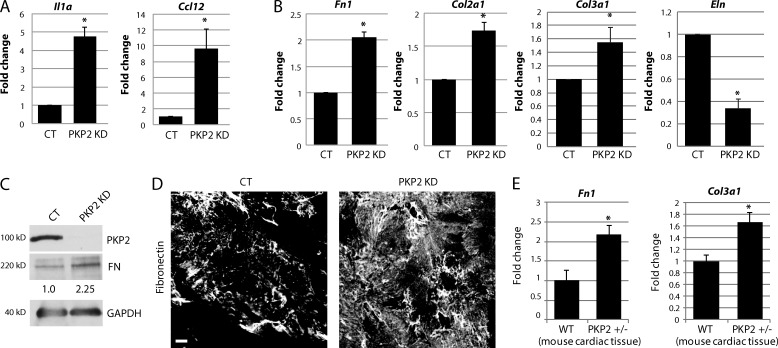
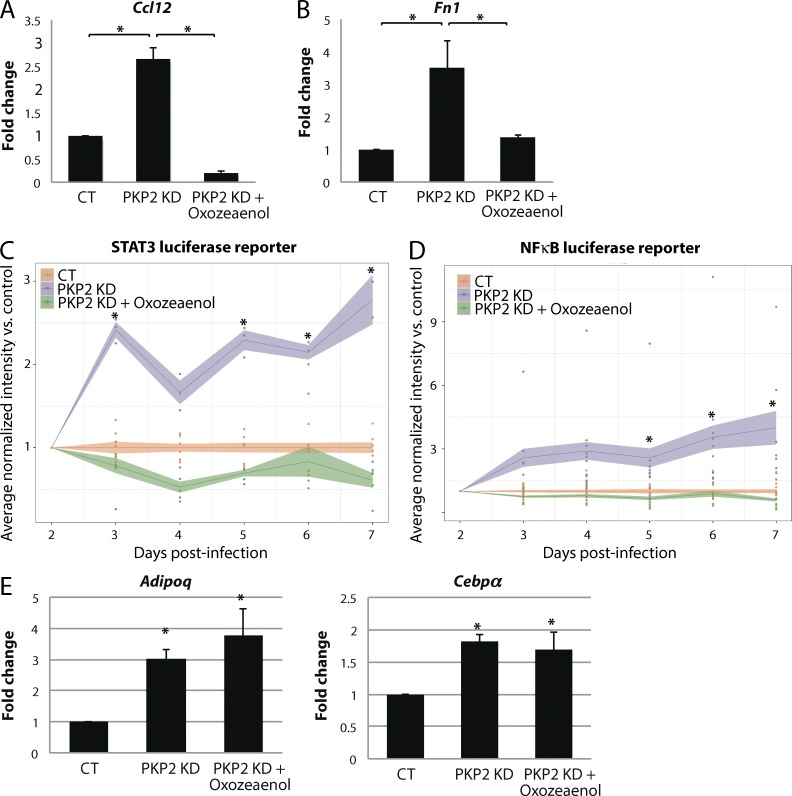
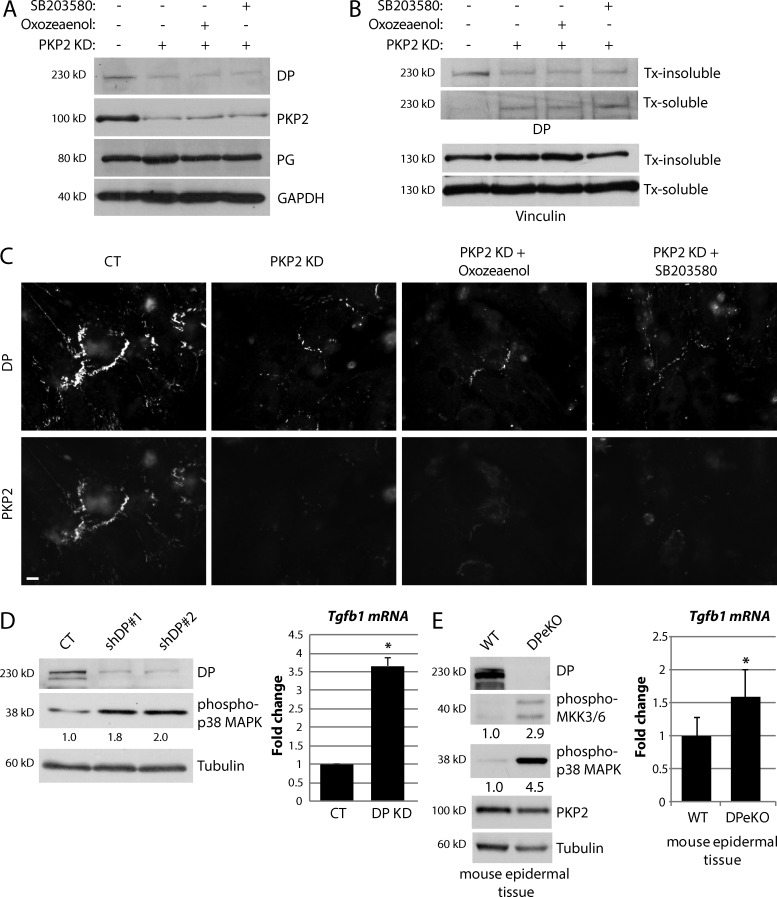
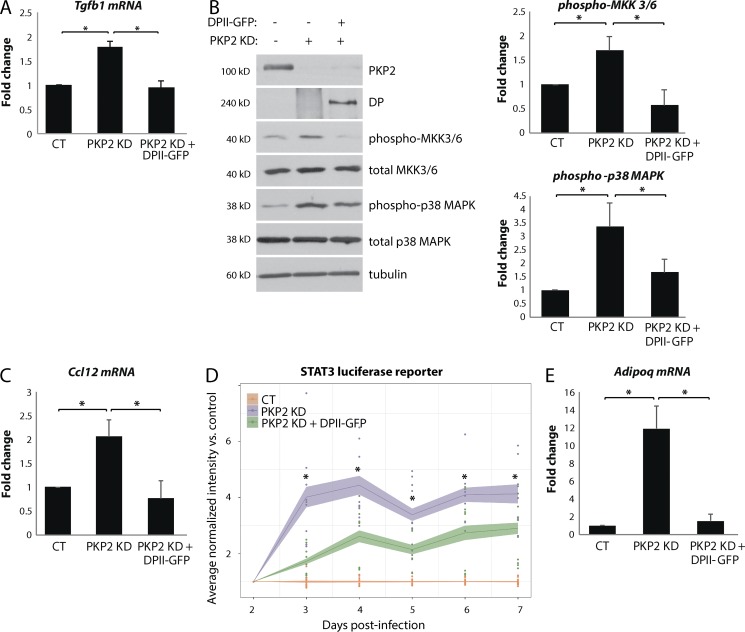
Members of the desmosome protein family are integral components of the cardiac area composita, a mixed junctional complex responsible for electromechanical coupling between cardiomyocytes. In this study, we provide evidence that loss of the desmosomal armadillo protein Plakophilin-2 (PKP2) in cardiomyocytes elevates transforming growth factor β1 (TGF-β1) and p38 mitogen-activated protein kinase (MAPK) signaling, which together coordinate a transcriptional program that results in increased expression of profibrotic genes. Importantly, we demonstrate that expression of Desmoplakin (DP) is lost upon PKP2 knockdown and that restoration of DP expression rescues the activation of this TGF-β1/p38 MAPK transcriptional cascade. Tissues from PKP2 heterozygous and DP conditional knockout mouse models also exhibit elevated TGF-β1/p38 MAPK signaling and induction of fibrotic gene expression in vivo. These data therefore identify PKP2 and DP as central players in coordination of desmosome-dependent TGF-β1/p38 MAPK signaling in cardiomyocytes, pathways known to play a role in different types of cardiac disease, such as arrhythmogenic or hypertrophic cardiomyopathy.


Figures

Figure 1.
Figure 1.
PKP2 KD in neonatal CMs disrupts area composita formation via loss of DP localization and stability. Freshly isolated neonatal CMs were infected with adenovirus containing either control or PKP2 KD constructs, and samples were analyzed 72 h postinfection. (A) Control (CT) and PKP2 KD CMs grown on coverslips were stained for cell–cell junction components, including PKP2, PG, DP, β-catenin, p120-catenin, and Cnx43. PKP2 KD specifically results in a major loss of DP and Cnx43 from junctions, but not other junctional markers. Bar, 20 µm. (B) Protein levels of cell–cell junction proteins are not perturbed on loss of PKP2, except DP, whose expression is reduced by 60–70%. (C) Re-expression of human V5-tagged PKP2 in rat PKP2 KD CMs rescues DP protein levels. A pool of two antibodies was used to analyze PKP2 levels in this experiment (described in Materials and methods). (D) PKP2 KD results in an increase in DP solubility, as indicated by a decrease in DP levels in the Triton X-100 (Tx)–insoluble fraction and a concomitant increase in the Triton X-100–soluble fraction. Solubility of the intermediate filament protein Desmin is also increased, but solubility of other junctional markers such as β-catenin is not affected. Vinculin is included as a loading control. (E) RNA extracted from control and PKP2 KD cells was analyzed for Dsp mRNA levels by qPCR. Transcription of DP is not decreased on loss of PKP2 KD in CMs. (F) Control and PKP2 KD cells were treated with cycloheximide (CHX) for the indicated times, and samples are blotted for DP and tubulin. Degradation of DP is increased in PKP2 KD cells compared with control, as indicated by quantification of DP band intensity (normalized to tubulin) at the various time points. All images and blots shown are representative of three independent experiments. (G) Control, PKP2 KD, and PKP2 KD CMs treated with either a proteasomal inhibitor (MG132) or a lysosomal inhibitor (chloroquine) were blotted for DP and tubulin (loading control). DP expression in PKP2 KD cells was restored by proteasomal inhibition, but not lysosomal inhibition.
Figure 2.
Figure 2.
PKP2 loss triggers an increase in TGF-β1 expression and transcriptional signaling. (A) RNA isolated from control (CT) and PKP2 KD CMs were analyzed for mRNA levels of the TGF-β genes. Tgfb1 (but not Tgfb2 or Tgfb3) mRNA levels were significantly increased on KD of PKP2. (B). Levels of TGF-β1 were analyzed in the cell culture supernatants of control and PKP2 KD cells 72 h after KD by performing a TGF-β1 ELISA. These data indicate a significant increase in secreted TGF-β1 on loss of PKP2. (C) RNA isolated from wild-type and PKP2+/− mouse heart tissue were analyzed for mRNA levels of Tgfb1. Haploinsufficiency of PKP2 results in a significant increase in Tgfb1 mRNA in vivo. (D–F) SMAD3, STAT3, and NF-κB transcriptional activity was followed via luciferase reporter arrays (see Materials and methods). After control and PKP2 KD in 96-well plates, CMs were infected with luciferase reporter constructs for SMAD3, STAT3, or NF-κB and luciferase expression followed in the same cells by noninvasive imaging for a period of 6 d. KD of PKP2 caused a significant increase in transcriptional activity of SMAD3, STAT3, and NF-κB. For all graphs, fold change values from three independent samples are represented with error bars indicating SD. *, P < 0.05.
Figure 3.
Figure 3.
PKP2 KD results in activation of a p38 MAPK signaling cascade. (A) Control (CT) and PKP2 KD CMs were blotted for phosphorylated forms of TAK1, MKK3/6, and p38 MAPK, all of which are increased on loss of PKP2. (B) Wild-type (WT) and PKP2+/− mouse heart samples were lysed and blotted for DP, PKP2, tubulin, and phosphorylated forms of MKK3/6 and p38 MAPK. Loss of PKP2 expression results in activation of p38 MAPK in vivo, quantified in the graph (right). (C) KD of PKP2 in the HL1 cardiomyocyte cell line recapitulates these results, showing an increase in phospho-MKK3/6 and phospho–p38 MAPK compared with controls. Loss of DP expression is also demonstrated in this cell line. (D) Freshly isolated cultures of control and PKP2 KD CMs grown on coverslips were stained for phospho–p38 MAPK. These data indicate an increase in nuclear staining of phospho–p38 MAPK on loss of PKP2. Bar, 20 µm. (E). Re-expression of human V5-tagged PKP2 in rat PKP2 KD CMs rescues the increase in phospho–p38 MAPK. A pool of two antibodies was used to analyze PKP2 levels in this experiment (described in Materials and methods). Quantification of these results across multiple experiments are shown in the graph (right). For all graphs, fold change values from three independent samples are represented with error bars indicating SD. *, P < 0.05. NRVCM, neonatal rat ventricular CM.
Figure 4.
Figure 4.
Activation of p38 MAPK in PKP2 KD CMs occurs via up-regulation of TGF-β1 signaling. (A and B) Control (CT), PKP2 KD, and PKP2 KD CMs treated with either a TGFβR1 inhibitor (SB431542) (A) or a TAK1 inhibitor [(5Z)-7-Oxozeaenol] (B) were blotted for phosphorylated forms of MKK3/6 and p38 MAPK. Inhibition of either TGFβR1 or TAK1 abrogates the activation of the downstream kinases MKK 3/6 and p38 MAPK seen on loss of PKP2. (C) Tgfb1 mRNA levels are analyzed in control, PKP2 KD, and PKP2 KD cells treated with the p38 MAPK inhibitor SB203580. The increase in Tgfb1 mRNA levels is not abrogated by inhibition of p38 MAPK. (D) Normal CMs were treated with TGF-β1 ligand for 4 h, lysed, and blotted for phosphorylated forms of MKK3/6 and p38 MAPK. These data indicate that stimulation of CMs with TGF-β1 is sufficient to induce activation of the p38 MAPK pathway in CMs. All images and blots shown are representative of three independent experiments. For all graphs, fold change values from three independent samples are represented with error bars indicating SD. *, P < 0.05.
Figure 5.
Figure 5.
Loss of PKP2 induces inflammatory and fibrotic gene expression. (A and B) Freshly isolated neonatal CMs were infected with adenovirus containing either control (CT) or PKP2 KD constructs, and samples were analyzed 72 h postinfection. RNA isolated from control and PKP2 KD CMs were analyzed for mRNA levels of different genes by qPCR. KD of PKP2 in neonatal CMs resulted in a significant increase in mRNA levels of proinflammatory markers interleukin-1α (Il1a) and Ccl12 (A) and ECM genes fibronectin (Fn1) and collagen (Col2A1 and Col3a1) (B). Expression of Elastin (Eln) was reduced on loss of PKP2. (C) KD of PKP2 results in an increase in FN protein levels, as indicated by quantification of FN band intensity (normalized to GAPDH). (D) Control and PKP2 KD CMs were stained with an anti-FN antibody. KD of PKP2 results in an increase in FN expression as indicated by the increase in staining intensity of FN by immunofluorescence. Bar, 20 µm. (E) Analysis of RNA from wild-type (WT) and PKP2+/− mouse hearts demonstrated a significant increase in expression of fibrotic genes such as Fn1 and Col3a1 on loss of PKP2 expression in vivo. All images and blots shown are representative of three independent experiments. For all graphs, fold change values from three or more independent samples are represented with error bars indicating SD. *, P < 0.05.
Figure 6.
Figure 6.
Abrogation of TGF-β1/p38 MAPK signaling in PKP2 KD CMs rescues fibrotic gene expression, but not adipogenesis. (A and B) Control (CT), PKP2 KD, and PKP2 KD CMs treated with the TAK1 inhibitor (5Z)-7-Oxozeaenol were analyzed for mRNA levels of Ccl12 and fibronectin (Fn1). Treatment with oxozeaenol was able to rescue the increase in Ccl12 and Fn1 mRNA seen on loss of PKP2. (C and D) Control, PKP2 KD, and PKP2 KD CMs treated with oxozeaenol were analyzed for STAT3 and NF-κB transcriptional activity via luciferase reporter arrays. Luciferase expression followed in the same cells by noninvasive imaging for a period of 6 d indicated that TAK1 inhibition was able to rescue the increases in STAT3 and NF-κB transcriptional activity seen on KD of PKP2 in CMs. *, P < 0.05 for PKP2 KD values compared with PKP2 KD + oxozeaenol values. (E) RNA isolated from control and PKP2 KD CMs were analyzed for mRNA levels of adipogenic markers such as adiponectin (Adipoq) and CEBPα (Cebpa). Adipoq and Cebpa mRNA was increased on loss of PKP2 but could not be rescued by treatment with the TAK1 inhibitor oxozeaenol. For all graphs, fold change values from three or more independent samples are represented with error bars indicating SD. *, P < 0.05.
Figure 7.
Figure 7.
Activation of TGF-β1/p38 MAPK signaling in cardiac cells is regulated by DP expression. (A–C). Control (CT), PKP2 KD, and PKP2 KD CMs treated with either the TAK1 inhibitor (5Z)-7-oxozeaenol or p38 MAPK inhibitor SB203580 were analyzed for total protein levels of DP (A), solubility of DP using Triton X-100 fractionation assays (B), and junctional localization of DP (C). Neither TAK1 nor p38 MAPK inhibition was able to rescue the loss of DP protein expression, increase in DP solubility, or loss of junctional localization of DP, all of which are seen on loss of PKP2 KD in CMs. Bar, 20 µm. (D) Control and DP KD cells were analyzed for levels of phospho–p38 MAPK and Tgfb1 mRNA, both of which were up-regulated on loss of DP expression. (E) Tissue samples from wild-type (WT) and DP epidermal knockout (DPeKO) mice were processed for protein and RNA analysis. Loss of DP expression resulted in activation of phospho–p38 MAPK and an increase in Tgfb1 mRNA in the epidermis. For all graphs, fold change values from three or more independent samples are represented with error bars indicating SD. *, P < 0.05.
Figure 8.
Figure 8.
Rescue of DP expression in PKP2 KD cells restores normal levels of TGF-β1/p38 MAPK signaling. (A–E) Freshly isolated neonatal CMs were infected with adenovirus containing control, PKP2 KD, or PKP2 KD + DPII-GFP constructs. 72 h postinfection, cells were analyzed for mRNA levels of Tgfb1 (A), Ccl12 (C), or Adipoq (E) by qPCR, blotted for phosphorylated forms of MKK3/6 and p38 MAPK (quantified in the graphs, right panels) (B), or analyzed for STAT3 transcriptional activity via luciferase reporter arrays (D). *, P < 0.05 for PKP2 KD values compared with PKP2 KD + DPII-GFP values. The induction of all of these phenotypes observed on loss of PKP2 were rescued by re-expression of DPII-GFP. All images and blots shown are representative of three independent experiments. For all graphs, fold change values from three or more independent samples are represented with error bars indicating SD. *, P < 0.05.

References

    1. Aden N., Nuttall A., Shiwen X., de Winter P., Leask A., Black C.M., Denton C.P., Abraham D.J., and Stratton R.J.. 2010. Epithelial cells promote fibroblast activation via IL-1alpha in systemic sclerosis. J. Invest. Dermatol. 130:2191–2200. 10.1038/jid.2010.120 - DOI - PubMed
    1. Aguado B.A., Wu J.J., Azarin S.M., Nanavati D., Rao S.S., Bushnell G.G., Medicherla C.B., and Shea L.D.. 2015. Secretome identification of immune cell factors mediating metastatic cell homing. Sci. Rep. 5:17566 10.1038/srep17566 - DOI - PMC - PubMed
    1. Angst B.D., Nilles L.A., and Green K.J.. 1990. Desmoplakin II expression is not restricted to stratified epithelia. J. Cell Sci. 97:247–257. - PubMed
    1. Arimoto K., Burkart C., Yan M., Ran D., Weng S., and Zhang D.-E.E.. 2014. Plakophilin-2 promotes tumor development by enhancing ligand-dependent and -independent epidermal growth factor receptor dimerization and activation. Mol. Cell. Biol. 34:3843–3854. 10.1128/MCB.00758-14 - DOI - PMC - PubMed
    1. Asimaki A., Tandri H., Duffy E.R., Winterfield J.R., Mackey-Bojack S., Picken M.M., Cooper L.T., Wilber D.J., Marcus F.I., Basso C., et al. . 2011. Altered desmosomal proteins in granulomatous myocarditis and potential pathogenic links to arrhythmogenic right ventricular cardiomyopathy. Circ Arrhythm Electrophysiol. 4:743–752. 10.1161/CIRCEP.111.964890 - DOI - PMC - PubMed

Publication types

MeSH terms