

Introduction to the Analysis of Survival Data in the Presence of Competing Risks
- PMID: 26858290
- PMCID: PMC4741409
- DOI: 10.1161/CIRCULATIONAHA.115.017719
Introduction to the Analysis of Survival Data in the Presence of Competing Risks
Abstract
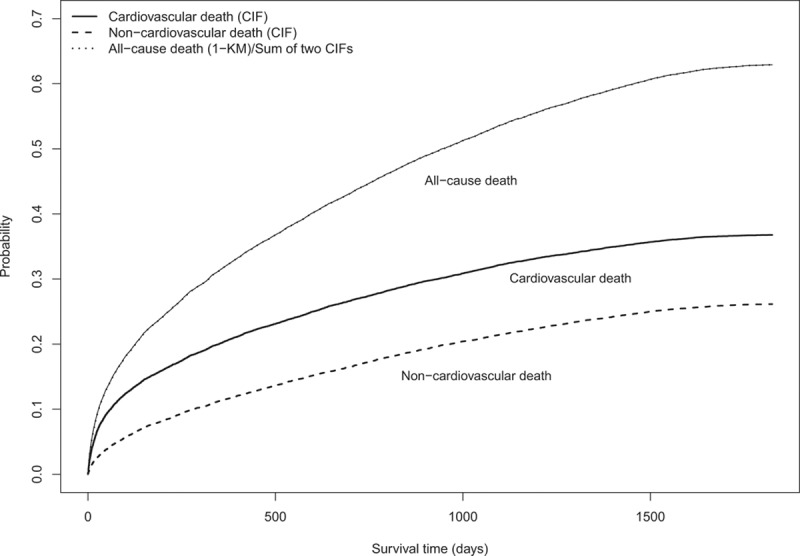
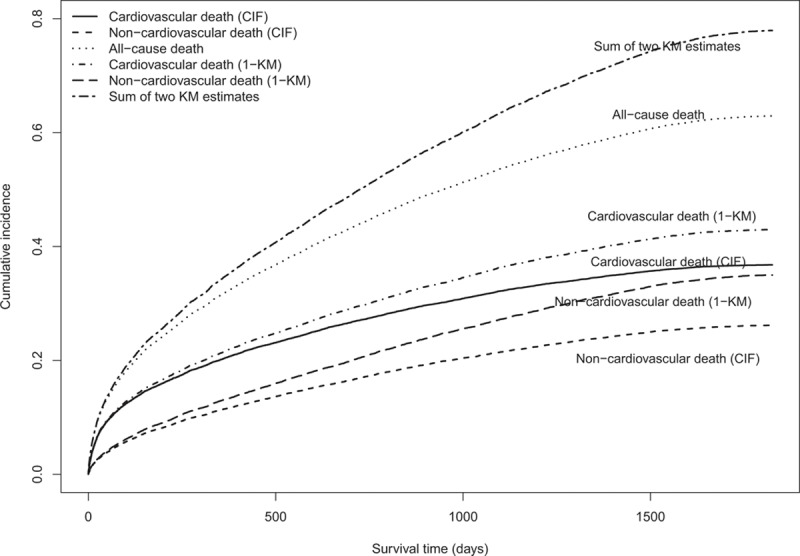
Competing risks occur frequently in the analysis of survival data. A competing risk is an event whose occurrence precludes the occurrence of the primary event of interest. In a study examining time to death attributable to cardiovascular causes, death attributable to noncardiovascular causes is a competing risk. When estimating the crude incidence of outcomes, analysts should use the cumulative incidence function, rather than the complement of the Kaplan-Meier survival function. The use of the Kaplan-Meier survival function results in estimates of incidence that are biased upward, regardless of whether the competing events are independent of one another. When fitting regression models in the presence of competing risks, researchers can choose from 2 different families of models: modeling the effect of covariates on the cause-specific hazard of the outcome or modeling the effect of covariates on the cumulative incidence function. The former allows one to estimate the effect of the covariates on the rate of occurrence of the outcome in those subjects who are currently event free. The latter allows one to estimate the effect of covariates on the absolute risk of the outcome over time. The former family of models may be better suited for addressing etiologic questions, whereas the latter model may be better suited for estimating a patient's clinical prognosis. We illustrate the application of these methods by examining cause-specific mortality in patients hospitalized with heart failure. Statistical software code in both R and SAS is provided.
Keywords: cumulative incidence function; data interpretation, statistical; incidence; models, statistical; proportional hazards models; risk assessment; survival analysis.
© 2016 The Authors.
Figures
References
-
- Kalbfleisch JD, Prentice RL. The Statistical Analysis of Failure Time Data. 2nd ed. New York, NY: John Wiley and Sons; 2002.
-
- Cox D. Regression models and life tables (with discussion). J Roy Stat Soc - Series B. 1972;34:187–220.
-
- Cox D, Oakes D. Analysis of Survival Data. London, UK: Chapman & Hall; 1984.
-
- Therneau TM, Grambsch PM. Modeling Survival Data: Extending the Cox Model. New York, NY: Springer-Verlag; 2000.
-
- Klein JP, Moeschberger ML. Survival Analysis: Techniques for Censored and Truncated Data. New York, NY: Springer-Verlag; 1997.
Publication types
MeSH terms
Grants and funding
LinkOut - more resources
Full Text Sources
Other Literature Sources
Medical
