. 2016 Feb 23;113(8):2158-63.
doi: 10.1073/pnas.1514473113. Epub 2016 Feb 8.

Brain shape convergence in the adaptive radiation of New World monkeys

Affiliations

Brain shape convergence in the adaptive radiation of New World monkeys

Leandro Aristide et al. Proc Natl Acad Sci U S A. .

Abstract

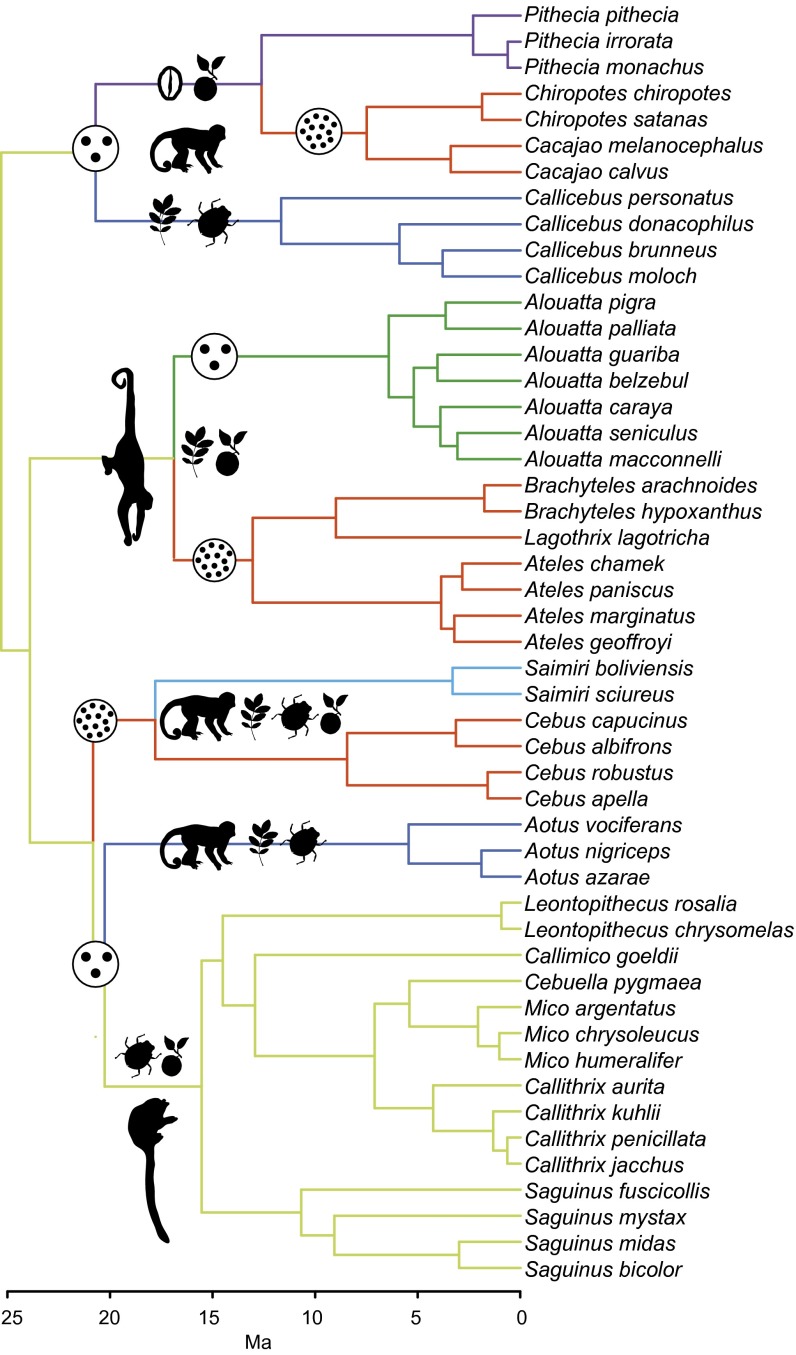
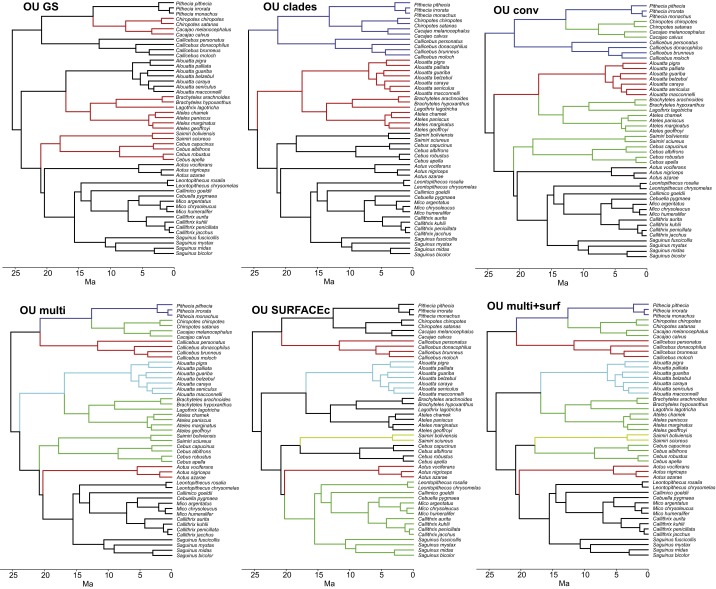
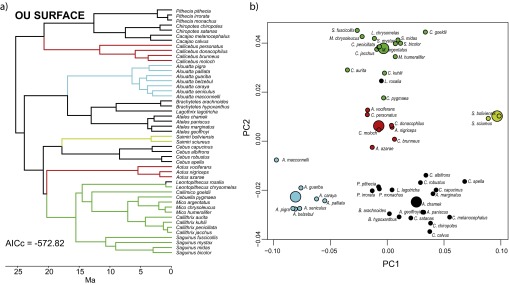
Primates constitute one of the most diverse mammalian clades, and a notable feature of their diversification is the evolution of brain morphology. However, the evolutionary processes and ecological factors behind these changes are largely unknown. In this work, we investigate brain shape diversification of New World monkeys during their adaptive radiation in relation to different ecological dimensions. Our results reveal that brain diversification in this clade can be explained by invoking a model of adaptive peak shifts to unique and shared optima, defined by a multidimensional ecological niche hypothesis. Particularly, we show that the evolution of convergent brain phenotypes may be related to ecological factors associated with group size (e.g., social complexity). Together, our results highlight the complexity of brain evolution and the ecological significance of brain shape changes during the evolutionary diversification of a primate clade.

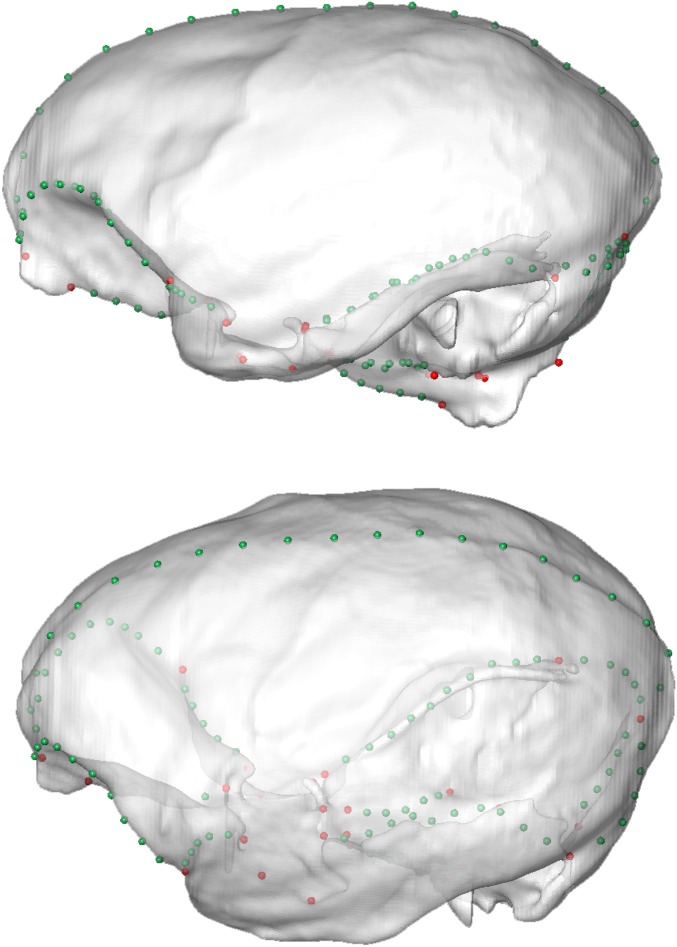
Keywords: Platyrrhini; adaptive evolution; comparative method; geometric morphometrics; primates.


Conflict of interest statement

The authors declare no conflict of interest.

Figures

Fig. 1.
Fig. 1.
Morphometric analysis of New World monkey’s brain shape. (A) Ordination of 49 platyrrhine species in the morphospace defined by the first two principal components (PCs) of brain shape variation, which together account for ∼61% of total variance. Endocast at Left shows the measured landmarks (red), and curves (green) and surfaces (blue) semilandmarks on each individual (see also Fig. S6 and Table S2). Encephalization values (relative ECV) for each species are depicted by the color of each data point. Additionally, the three platyrrhine families are indicated, along with the genus Aotus, whose position in the platyrrhine tree is contentious. (B) Brain shape changes associated with the main axes of variation. Models were obtained by warping a surface model of the mean platyrrhine shape along PC1 and PC2 scores. See also Movies S1 and S2.
Fig. S1.
Fig. S1.
PGLS regression of log endocranial volume (ECV) on the log of the cranial base centroid size (CS) (λ = 0.96; R2 = 0.88; P = 0.0001). Residuals of this regression were used as a measure of relative endocranial—or brain—volume or encephalization (rECV).
Fig. S2.
Fig. S2.
Measured rECV (encephalization) values for each species mapped on the phylogeny. Values at nodes and branches were reconstructed using a maximum-likelihood ancestral character estimation method based on a Brownian motion model of evolution (57). Although ancestral reconstructions can have a large uncertainty, this tool is useful to visualize general trends in the evolution of a character.
Fig. S3.
Fig. S3.
PGLS regression of encephalization (rECV) on the main axis of platyrrhine brain shape variation (PC1). Colors in the brain model shows the areas in which shape change is concentrated along PC1. Red colors indicate the most shape change, whereas blue colors indicate less change. Colors were assigned based on a Procrustean superimposition of the extremes of variation along PC1.
Fig. 2.
Fig. 2.
Disparity-through-time (DTT) plots for brain shape, encephalization (rECV), and log body mass (BM). Relative disparity at each point indicates the average extant disparity of the subclades that had an ancestor at that time with respect to the whole clade disparity. Dashed line and gray shadow represent the expectation under a BM model of evolution, estimated via simulations, and its 95% confidence interval, respectively.
Fig. 3.
Fig. 3.
Time-calibrated phylogenetic tree for the studied New World monkey species showing adaptive regimes for the best-fitting model of brain shape evolution. Regimes were assigned based on diet composition, locomotion strategy, and group size with exception of Saimiri, which was assigned based on the SURFACE results (Supporting Information). Drawings broadly depict the ecological categories that define these regimes and are not intended to represent ancestral states. Diets are represented by niche-defining food items (17). Locomotion is represented by typical behaviors. Group size (small and large) is represented by encircled dots. Convergent regimes are defined by having large group size. Aotus and Callicebus are considered by some workers to be sister clades.
Fig. S4.
Fig. S4.
Alternative multivariate OU hypotheses for the evolution of platyrrhine brain shape. The trees depict the different multiregime OU hypotheses included in the model selection analyses performed in mvMORPH. The first model (OU GS) hypothesizes group size (GS) as the only defining dimension of the adaptive landscape for brain shape [large GS species (i.e., 15 or more individuals) vs. small GS species]. The second model (OU clades) considers a fully phylogenetic hypothesis where each platyrrhine family occupies a separate adaptive peak. The third model (OU conv) is a more complex model (five regimes) where each family occupies an adaptive peak but GS drives morphological convergence. “OU multi” model is equally complex as “OU conv” model but hypothesizes an adaptive landscape defined by three ecological dimensions (diet composition, locomotion strategy, and GS; Supporting Information). In this model, GS is also the ecological dimension driving brain shape convergence. The other two ecological dimensions were previously used to explain phenotypic diversification (e.g., in body size) in the platyrrhine adaptive radiation (17, 18). The “OU SURFACEc” model is a slightly modified version of the best-fitting model returned by the SURFACE analysis. The last model (“OU multi + surf”) is a modified version of the OU multi model after the SURFACE results, in which Saimiri is assigned a different adaptive regime. Additionally to these multiregime OU models, we also fitted a single-peak OU, Brownian motion, and early-burst models.
Fig. S5.
Fig. S5.
Results of the SURFACE analysis. Adaptive regimes for the best-fitting model found by SURFACE are mapped on the platyrrhine tree (A) and in the morphospace of PC1 and PC2 (B). Large circles in B represent the position of the estimated optima for each regime.
Fig. S6.
Fig. S6.
Landmarks and curves semilandmarks used in this study. Curves were placed to delimitate different anatomical regions of the brain, such as the frontal from the temporal lobe or the cerebellum and stem areas from the rest of the brain. Also, the left and right hemispheres are separated by a curve (Table S2).

References

    1. Futuyma DJ. 1998. Evolutionary Biology (Sinauer Associates, Sunderland, MA)
    1. Gavrilets S, Losos JB. Adaptive radiation: Contrasting theory with data. Science. 2009;323(5915):732–737. - PubMed
    1. Simpson GG. The Major Features of Evolution. Columbia Univ Press; New York: 1953.
    1. Losos JB. Adaptive radiation, ecological opportunity, and evolutionary determinism. American Society of Naturalists E. O. Wilson Award Address. Am Nat. 2010;175(6):623–639. - PubMed
    1. Jønsson KA, et al. Ecological and evolutionary determinants for the adaptive radiation of the Madagascan vangas. Proc Natl Acad Sci USA. 2012;109(17):6620–6625. - PMC - PubMed

Publication types

LinkOut - more resources