Comparative Study
. 2016 Mar 15;113(11):3066-71.
doi: 10.1073/pnas.1518129113. Epub 2016 Feb 8.

Seasonality in human cognitive brain responses

Affiliations
Comparative Study

Seasonality in human cognitive brain responses

Christelle Meyer et al. Proc Natl Acad Sci U S A. .

Abstract

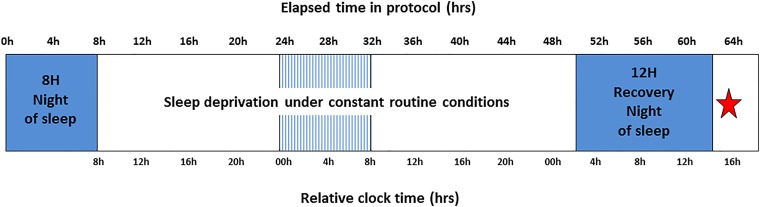
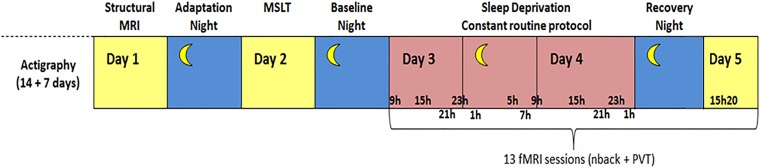
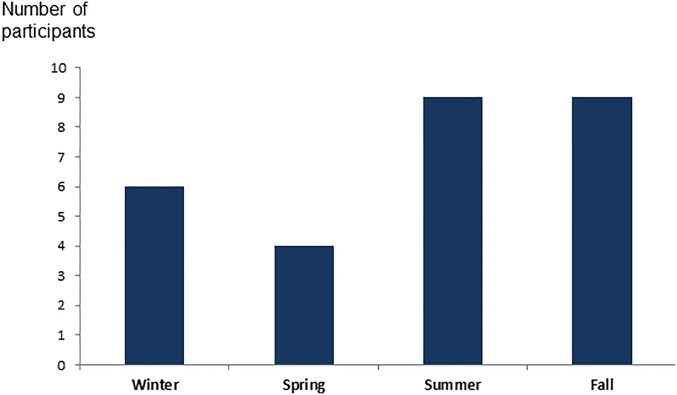
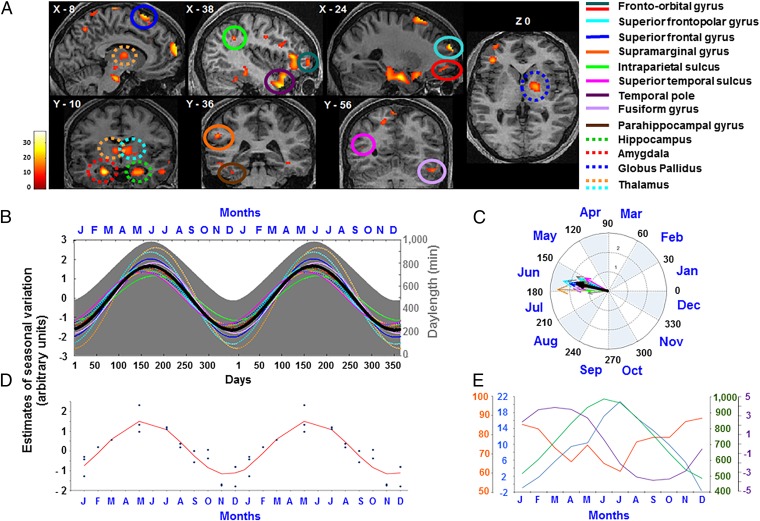
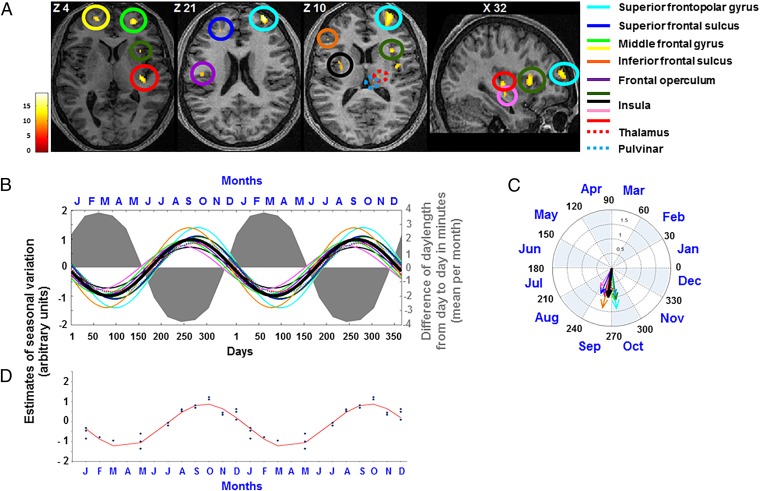
Daily variations in the environment have shaped life on Earth, with circadian cycles identified in most living organisms. Likewise, seasons correspond to annual environmental fluctuations to which organisms have adapted. However, little is known about seasonal variations in human brain physiology. We investigated annual rhythms of brain activity in a cross-sectional study of healthy young participants. They were maintained in an environment free of seasonal cues for 4.5 d, after which brain responses were assessed using functional magnetic resonance imaging (fMRI) while they performed two different cognitive tasks. Brain responses to both tasks varied significantly across seasons, but the phase of these annual rhythms was strikingly different, speaking for a complex impact of season on human brain function. For the sustained attention task, the maximum and minimum responses were located around summer and winter solstices, respectively, whereas for the working memory task, maximum and minimum responses were observed around autumn and spring equinoxes. These findings reveal previously unappreciated process-specific seasonality in human cognitive brain function that could contribute to intraindividual cognitive changes at specific times of year and changes in affective control in vulnerable populations.

Keywords: annual; attention; cognition; fMRI; season.


Conflict of interest statement

The authors declare no conflict of interest.

Figures

Fig. 1.
Fig. 1.
Schematic representation of the protocol. Following an 8-h baseline night of sleep in complete darkness, participants underwent a 42-h sleep deprivation under constant routine conditions in dim light (<5 lx, 19 °C, semirecumbent position, regular liquid isocaloric food intake, no time cues, sound-proofed room). They were then given a 12-h recovery sleep opportunity in darkness, an hour after which they completed fMRI recordings (red star). Functional MRI recordings were completed while lying down in darkness and included PVT and n-back tasks. Relative clock time for participants habitually waking up at 8:00 AM. Striped blue box during sleep deprivation represents the habitual sleep period. The figure represents the last ∼2.5 d of the protocol; see Fig. S1 for a description of the entire in-laboratory experiment.
Fig. S1.
Fig. S1.
Schematic representation of the entire experimental protocol, for a participant waking up at 8:00 AM. All participants respected 3 wk of regular sleep/wake schedule before coming to the laboratory (compliance verified with actigraphy). The first day was devoted to the structural MRI session before a habituation night of 8 h in our laboratory (scheduled from 00:00—08:00 hours). Through day 2, participants performed five MSLT before the baseline night of 8 h (same schedule as for the habituation night). From day 3 to the end of day 4, participants were sleep-deprived for 42 consecutive hours under constant routine conditions [semirecumbent position (except for fMRI sessions in a horizontal position), constant dim light (<5 lx at eye level), humidity (60%), and temperature (19 °C ± 1), no clock-time information, sound-proof room] and had an isocaloric liquid snack every 2 h. While participants were under sleep deprivation, they performed 12 n-back and PVT under fMRI. They performed a final fMRI session in the afternoon of the last day (still under CR conditions) 1 h after waking up from the 12-h recovery night. Only data of this last fMRI session are presented in this paper. Clock times of fMRI sessions during sleep deprivation and following recovery sleep are indicated on the lower axis (for an individual habitually sleeping from midnight to 8:00 AM).
Fig. S2.
Fig. S2.
Distribution of the participants through seasons. The vertical axis represents the number of participants. A χ2 analysis show a uniform distribution across seasons (χ2 = 2.57, df = 3, P = 0.46).
Fig. 2.
Fig. 2.
Seasonal variations in brain activity associated with sustained attention. (A) Significant (pcorrected < 0.05) seasonal variations in PVT brain responses displayed over the mean structural image of all participants (display at puncorrected < 0.001). Only clusters >30 voxels are displayed (see Table 1 for full results). Vertical color bar corresponds to F-test values (B) Double plot of PVT brain response estimates in regions of A in a sinusoidal representation. Day 1 corresponds to January 1. First letter of each month is displayed on top. Thick black line corresponds to average of all response estimates. Gray area represents daily da ylength (in minutes) in Liège. (C) Same as B in polar coordinates; arrow length represents seasonal variation amplitude. One degree is roughly equal to 1 d (360° for 365 d). Maximum responses were located between 152° and 188° (mean 168.9) (i.e., June 3 and July 9) (mean June 20). (D) Double plot of individual activity estimates in a representative region of A (amygdala) and its sinusoidal fit (red line). (E) Seasonal environmental factors recorded in Liège in 2011: temperature (Celsius degrees, blue), humidity (percent, red), day length (minutes, green), and day-to-day day-length gain/loss (minutes, violet).
Fig. S3.
Fig. S3.
Double plot of subjective mood across the year (values collected immediately before the fMRI session). The blue dots represent individual raw data (z-scored) and the black line represents the sinusoidal fit. Fitted maximum of subjective mood was observed on October 31 (i.e., 135 and 38 d later than the peak in PVT and n-back brain responses, respectively). n = 28. Two participants share the same subjective mood at days 123 and 333.
Fig. 3.
Fig. 3.
Seasonal variations in executive brain activity. Display as in Fig. 2. (A) Significant (pcorrected < 0.05) seasonal variations in auditory three-back brain responses minus control task brain responses (simple letter detection). (B) Executive brain response estimates in regions of A. Gray area represents day-to-day change in photoperiod in Liège (minutes). (C) Same as B in polar coordinates. Maximum responses were located between 243° and 282° (mean 265.75) (i.e., September 3 and October 12) (mean September 22). (D) Double plot of individual activity estimates in a representative regions of A (middle frontal region) and its sinusoidal fit (red line).

References

    1. Hut RA, Beersma DGM. Evolution of time-keeping mechanisms: Early emergence and adaptation to photoperiod. Philos Trans R Soc Lond B Biol Sci. 2011;366(1574):2141–2154. - PMC - PubMed
    1. Gaggioni G, Maquet P, Schmidt C, Dijk DJ, Vandewalle G. Neuroimaging, cognition, light and circadian rhythms. Front Syst Neurosci. 2014;8:126. - PMC - PubMed
    1. Bronson FH. Are humans seasonally photoperiodic? J Biol Rhythms. 2004;19(3):180–192. - PubMed
    1. Brennan PJ, Greenberg G, Miall WE, Thompson SG. Seasonal variation in arterial blood pressure. Br Med J (Clin Res Ed) 1982;285(6346):919–923. - PMC - PubMed
    1. Gordon DJ, et al. Seasonal cholesterol cycles: the Lipid Research Clinics Coronary Primary Prevention Trial placebo group. Circulation. 1987;76(6):1224–1231. - PubMed

Publication types