

Cortical response to categorical color perception in infants investigated by near-infrared spectroscopy
- PMID: 26858441
- PMCID: PMC4780595
- DOI: 10.1073/pnas.1512044113
Cortical response to categorical color perception in infants investigated by near-infrared spectroscopy
Abstract
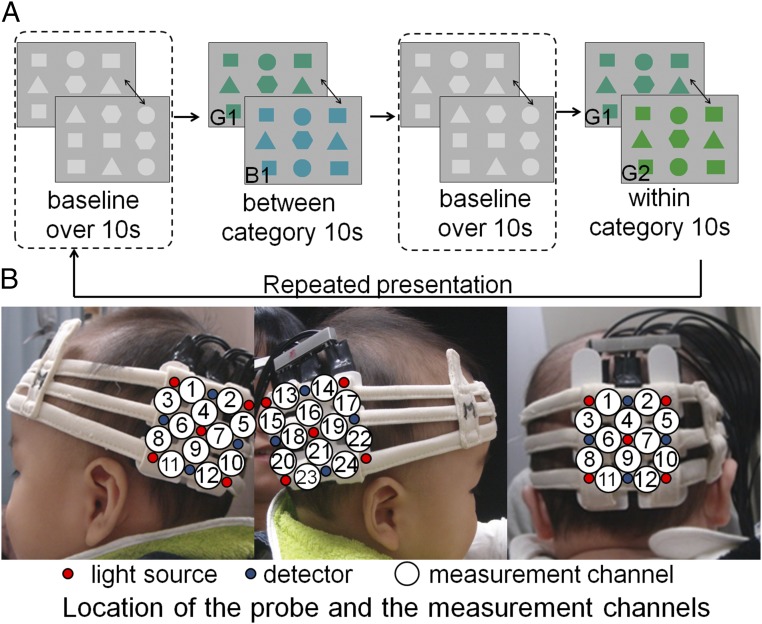
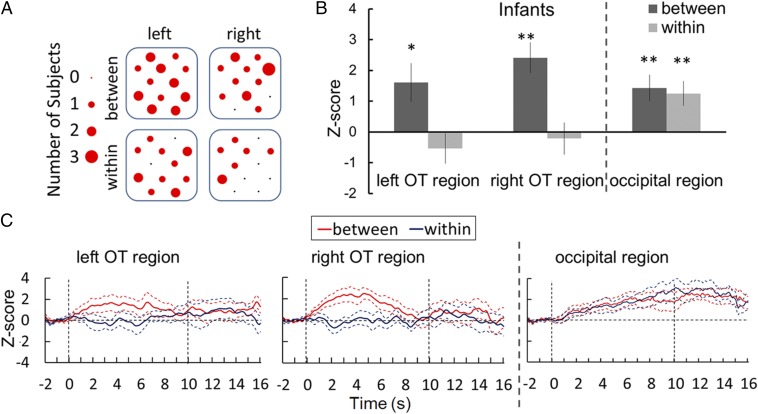
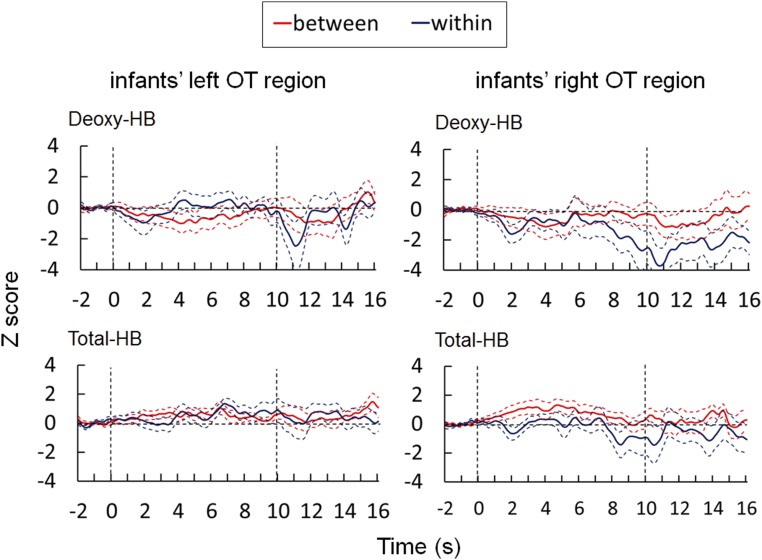
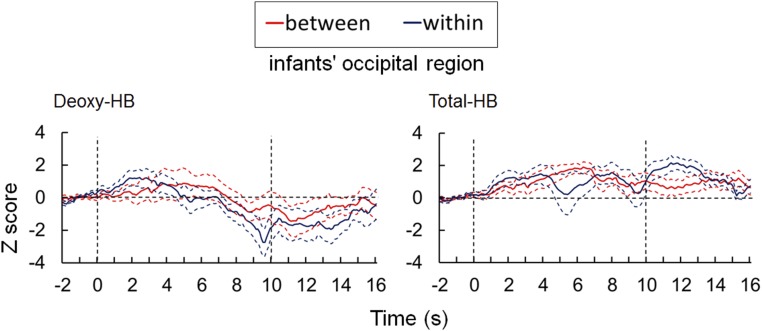
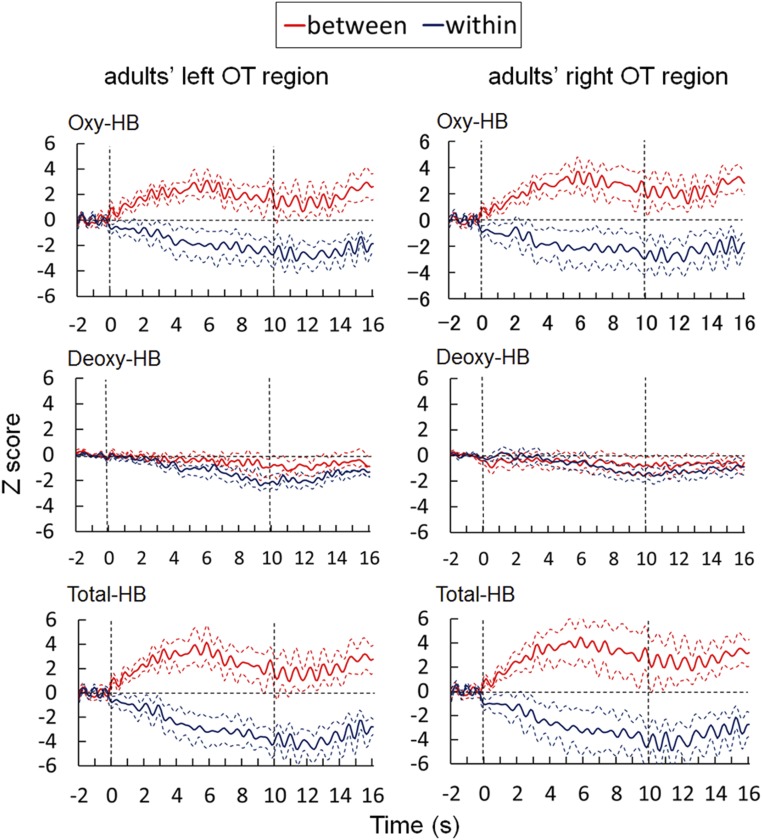
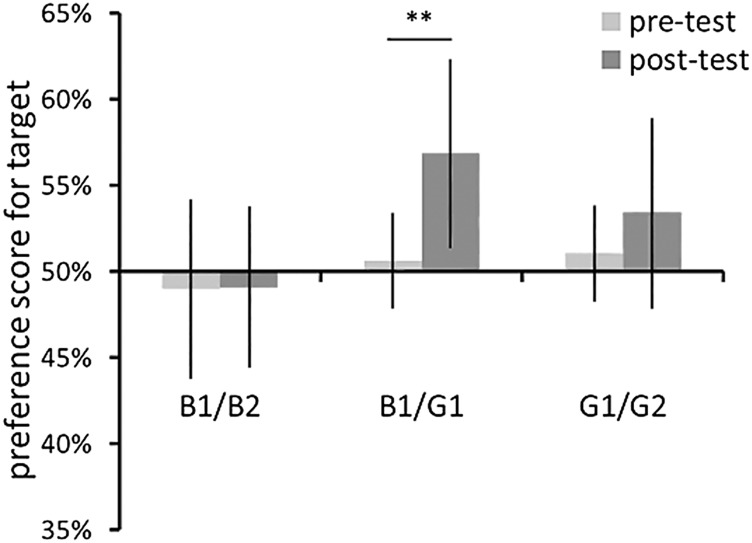
Perceptual color space is continuous; however, we tend to divide it into only a small number of categories. It is unclear whether categorical color perception is obtained solely through the development of the visual system or whether it is affected by language acquisition. To address this issue, we recruited prelinguistic infants (5- to 7-mo-olds) to measure changes in brain activity in relation to categorical color differences by using near-infrared spectroscopy (NIRS). We presented two sets of geometric figures to infants: One set altered in color between green and blue, and the other set altered between two different shades of green. We found a significant increase in hemodynamic responses during the between-category alternations, but not during the within-category alternations. These differences in hemodynamic response based on categorical relationship were observed only in the bilateral occipitotemporal regions, and not in the occipital region. We confirmed that categorical color differences yield behavioral differences in infants. We also observed comparable hemodynamic responses to categorical color differences in adults. The present study provided the first evidence, to our knowledge, that colors of different categories are represented differently in the visual cortex of prelinguistic infants, which implies that color categories may develop independently before language acquisition.
Keywords: categorical color perception; cortical response; infant; visual development.
Conflict of interest statement
The authors declare no conflict of interest.
Figures
Similar articles
-
Categorical perception of color is lateralized to the right hemisphere in infants, but to the left hemisphere in adults.Proc Natl Acad Sci U S A. 2008 Mar 4;105(9):3221-5. doi: 10.1073/pnas.0712286105. Epub 2008 Mar 3. Proc Natl Acad Sci U S A. 2008. PMID: 18316729 Free PMC article.
-
The nature of infant color categorization: evidence from eye movements on a target detection task.J Exp Child Psychol. 2005 Jul;91(3):227-48. doi: 10.1016/j.jecp.2005.03.003. J Exp Child Psychol. 2005. PMID: 15878166 Clinical Trial.
-
Electrophysiological markers of categorical perception of color in 7-month old infants.Brain Cogn. 2009 Nov;71(2):165-72. doi: 10.1016/j.bandc.2009.05.002. Epub 2009 Jun 5. Brain Cogn. 2009. PMID: 19501444
-
Race and Color: Two Sides of One Story? Development of Biases in Categorical Perception.Child Dev. 2017 Jan;88(1):83-102. doi: 10.1111/cdev.12564. Epub 2016 May 31. Child Dev. 2017. PMID: 27241823 Review.
-
A brain of two halves: insights into interhemispheric organization provided by near-infrared spectroscopy.Neuroimage. 2014 Jan 15;85 Pt 1:354-62. doi: 10.1016/j.neuroimage.2013.06.023. Epub 2013 Jun 14. Neuroimage. 2014. PMID: 23770412 Review.
Cited by
-
The origin of color categories.Proc Natl Acad Sci U S A. 2025 Jan 7;122(1):e2400273121. doi: 10.1073/pnas.2400273121. Epub 2024 Dec 30. Proc Natl Acad Sci U S A. 2025. PMID: 39793082 Free PMC article.
-
The Other-Race-Effect on Audiovisual Speech Integration in Infants: A NIRS Study.Front Psychol. 2020 May 15;11:971. doi: 10.3389/fpsyg.2020.00971. eCollection 2020. Front Psychol. 2020. PMID: 32499746 Free PMC article.
-
Biological origins of color categorization.Proc Natl Acad Sci U S A. 2017 May 23;114(21):5545-5550. doi: 10.1073/pnas.1612881114. Epub 2017 May 8. Proc Natl Acad Sci U S A. 2017. PMID: 28484022 Free PMC article.
-
Coordination Elicits Synchronous Brain Activity Between Co-actors: Frequency Ratio Matters.Front Neurosci. 2019 Oct 15;13:1071. doi: 10.3389/fnins.2019.01071. eCollection 2019. Front Neurosci. 2019. PMID: 31680812 Free PMC article.
-
Visual stimulus structure, visual system neural activity, and visual behavior in young human infants.PLoS One. 2024 Jun 18;19(6):e0302852. doi: 10.1371/journal.pone.0302852. eCollection 2024. PLoS One. 2024. PMID: 38889176 Free PMC article.
References
-
- Bornstein MH, Kessen W, Weiskopf S. Color vision and hue categorization in young human infants. J Exp Psychol Hum Percept Perform. 1976;2(1):115–129. - PubMed
-
- Franklin A, Davies IRL. New evidence for infant colour categories. Br J Dev Psychol. 2004;22(3):349–377.
-
- Franklin A, Pilling M, Davies I. The nature of infant color categorization: Evidence from eye movements on a target detection task. J Exp Child Psychol. 2005;91(3):227–248. - PubMed
Publication types
MeSH terms
LinkOut - more resources
Full Text Sources
Other Literature Sources
