. 2016 Feb 23;113(8):E997-1005.
doi: 10.1073/pnas.1514018113. Epub 2016 Feb 8.

High expression levels of macrophage migration inhibitory factor sustain the innate immune responses of neonates

Affiliations

High expression levels of macrophage migration inhibitory factor sustain the innate immune responses of neonates

Thierry Roger et al. Proc Natl Acad Sci U S A. .

Abstract

The vulnerability to infection of newborns is associated with a limited ability to mount efficient immune responses. High concentrations of adenosine and prostaglandins in the fetal and neonatal circulation hamper the antimicrobial responses of newborn immune cells. However, the existence of mechanisms counterbalancing neonatal immunosuppression has not been investigated. Remarkably, circulating levels of macrophage migration inhibitory factor (MIF), a proinflammatory immunoregulatory cytokine expressed constitutively, were 10-fold higher in newborns than in children and adults. Newborn monocytes expressed high levels of MIF and released MIF upon stimulation with Escherichia coli and group B Streptococcus, the leading pathogens of early-onset neonatal sepsis. Inhibition of MIF activity or MIF expression reduced microbial product-induced phosphorylation of p38 and ERK1/2 mitogen-activated protein kinases and secretion of cytokines. Recombinant MIF used at newborn, but not adult, concentrations counterregulated adenosine and prostaglandin E2-mediated inhibition of ERK1/2 activation and TNF production in newborn monocytes exposed to E. coli. In agreement with the concept that once infection is established high levels of MIF are detrimental to the host, treatment with a small molecule inhibitor of MIF reduced systemic inflammatory response, bacterial proliferation, and mortality of septic newborn mice. Altogether, these data provide a mechanistic explanation for how newborns may cope with an immunosuppressive environment to maintain a certain threshold of innate defenses. However, the same defense mechanisms may be at the expense of the host in conditions of severe infection, suggesting that MIF could represent a potential attractive target for immune-modulating adjunctive therapies for neonatal sepsis.

Keywords: Escherischia coli; adenosine; newborns; prostaglandin; sepsis.


Conflict of interest statement

The authors declare no conflict of interest.

Figures
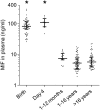
Fig. 1.
Fig. 1.
Circulating MIF concentrations are markedly elevated in newborns. MIF plasma levels were measured by ELISA in umbilical cord blood collected after birth in 60 newborns and in peripheral blood of 10 newborns (on postnatal day 4), 17 infants (1–12 mo), 73 children (1–16 y), and 58 adults (>16 y). The median and the interquartile range are shown. *P < 0.05 versus infants, children, and adults.
Fig. S1.
Fig. S1.
Circulating MIF levels are higher in newborns compared with adults. Western blot analysis of MIF in umbilical cord blood of healthy-term newborns (NB) and in peripheral blood of adult (AD) volunteers. Data are representative of the results obtained in 20 NB and 20 AD volunteers.
Fig. 2.
Fig. 2.
Higher baseline and E. coli and GBS-induced MIF levels in newborns than in adults. (A and B) Umbilical cord and adult whole blood were diluted fivefold in RPMI medium and stimulated with E. coli or GBS (106–108 bacteria/mL). MIF concentrations were measured by ELISA in supernatant collected after 24 h. Data represent means ± SEMs of 6–7 independent experiments performed in triplicates. *P < 0.05 versus controls. (C and D) Intracellular MIF was detected by Western blot in freshly isolated newborn (NB) and adult (AD) monocytes. Densitometric values (means ± SEMs, n = 14) are expressed in A.U. *P < 0.05. (E) Newborn monocytes cultured in autologous plasma were stimulated with E. coli or GBS (108 bacteria/mL). MIF concentrations were measured by ELISA in supernatant collected at the indicated time. Data represent means ± SEMs of five independent experiments performed in triplicates. *P < 0.05 versus controls.
Fig. S2.
Fig. S2.
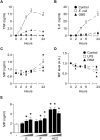
Time course of cytokine production and release in newborn monocytes. Newborn monocytes cultured in RPMI medium supplemented with 10% autologous plasma (A–D) or 10% charcoal-stripped FCS (E) were stimulated with E. coli, GBS (108 bacteria/mL), LPS (100 ng/mL), or Pam3CSK4 (PAM, 1 µg/mL) or were exposed to estradiol (E, 10−9–10−7 M), progesterone (P, 10−7–10−5 M), or hydrocortisone (HCZ, 10−8–10−6 M). TNF (A), IL-6 (B), and MIF (C and E) were measured by ELISA in supernatants collected at the indicated time (A–D) or 24 h (E). Intracellular MIF was detected by Western blotting, and densitometric values are expressed in A.U. relative to the expression of β-actin (D). Data represent means ± SEMs of 3–5 independent experiments performed in triplicates. *P < 0.05 versus control.
Fig. 3.
Fig. 3.
The MIF inhibitor ISO-1 reduces cytokine production by newborn monocytes. Newborn monocytes were incubated for 2 h with 100 µM ISO-1 (black bars) or solvent (DMSO, white bars) before stimulation with E. coli (107 bacteria/mL), GBS (107 bacteria/mL), LPS (100 ng/mL), or Pam3CSK4 (PAM, 1 µg/mL). TNF (A), IL-6 (B), and IL-8 (C) concentrations were measured by ELISA in cell culture supernatant collected after 18 h. Data represent means ± SEMs of five independent experiments performed in triplicates. *P < 0.05.
Fig. 4.
Fig. 4.
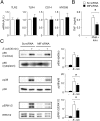
MIF silencing reduces cytokine production by newborn monocytes. Newborn monocytes were transfected with Scr (white bars) or MIF (black bars) siRNAs. Transfected cells were cultured for 48 h in RPMI medium supplemented with 10% autologous plasma before measurement of MIF mRNA or protein levels or stimulation with microbial products. MIF mRNA levels are expressed in A.U. relative to the expression of HPRT (A). Intracellular MIF levels were analyzed by Western blot. Signals were quantified by densitometric measurement (B). Cytokine concentrations in cell culture supernatants collected 18 h after stimulation with E. coli (107 bacteria/mL), GBS (107 bacteria/mL), LPS (100 ng/mL), or Pam3CSK4 (1 µg/mL) were measured by ELISA (C–E) and Luminex (F). Data represent means ± SEMs of 5–6 independent experiments performed in triplicates. *P < 0.05.
Fig. 5.
Fig. 5.
rhMIF restores E. coli-induced TNF production in MIF-silenced monocytes. Newborn monocytes were transfected with Scr (white bars) or MIF (black bars) siRNAs. Transfected cells were incubated for 1 h with or without 100 ng/mL rhMIF before stimulation for 18 h with E. coli. TNF concentrations in cell culture supernatants were measured by ELISA. Results are expressed as percent of E. coli-induced TNF release in newborn monocytes transfected with the Scr siRNA (control). Data represent means ± SEMs of three independent experiments performed in triplicates. *P < 0.05.
Fig. S3.
Fig. S3.
The MIF inhibitor ISO-1 reduces cytokine production by adult monocytes. Monocytes from adult volunteers were incubated for 2 h with 100 µM ISO-1 (black bars) or solvent (DMSO, white bars) before stimulation with E. coli (107 bacteria/mL), GBS (107 bacteria/mL), LPS (100 ng/mL), or Pam3CSK4 (PAM, 1 µg/mL). TNF (A), IL-6 (B), and IL-8 (C) concentrations were measured by ELISA in cell culture supernatant collected after 18 h. Data represent means ± SEMs of four independent experiments performed in triplicates. *P < 0.05.
Fig. S4.
Fig. S4.
Impact of MIF silencing on cytokine production by adult monocytes. Monocytes from adult volunteers were transfected with Scr (white bars) or MIF (black bars) siRNAs. Transfected cells were cultured for 48 h in RPMI medium supplemented with 10% autologous plasma before measurement of MIF protein levels or stimulation with microbial products. Intracellular MIF levels were analyzed by Western blotting. Signals were quantified by densitometric measurement (A). Cytokine concentrations in cell culture supernatants collected 18 h after stimulation with E. coli (107 bacteria/mL), GBS (107 bacteria/mL), LPS (100 ng/mL), or Pam3CSK4 (1 µg/mL) were measured by ELISA (B–D). Data represent means ± SEMs of four independent experiments performed in triplicates. *P < 0.05.
Fig. 6.
Fig. 6.
MIF silencing reduces E. coli-induced p38 and ERK1/2 MAPK activation in newborn monocytes. Newborn monocytes were transfected with Scr (white bars) or MIF (black bars) siRNAs. Transfected cells were cultured for 48 h before extraction of RNA (A) or stimulation with either PMA (10 ng/mL) plus ionomycin (Iono; 100 ng/mL) for 18 h (B) or E. coli (107/mL) for 30 min (C). (A) Gene-specific expression was normalized to the expression of HPRT, and data (means ± SEMs, n = 6) are expressed in A.U. (B) TNF concentrations in culture supernatants were measured by ELISA. Data represent means ± SEMs of four independent experiments performed in triplicates. *P < 0.05. (C) NF-κB p65 in nuclear and cytosolic extracts, phosphorylated (p) and total p38, and ERK1/2 in cytosolic extracts were detected by Western blot. Densitometric values (means ± SEMs) are expressed relative to expression in unstimulated monocytes transfected with Scr siRNA. Data represent means ± SEMs of five independent experiments. *P < 0.05.
Fig. S5.
Fig. S5.
MIF silencing reduces GBS-induced p38 and ERK1/2 MAPK activation in newborn monocytes. Newborn monocytes were transfected with Scr (white bars) or MIF (black bars) siRNAs. Transfected cells were cultured for 48 h before stimulation with GBS (107/mL) for 30 min. NF-κB p65 (p65) in nuclear and cytosolic extracts, phosphorylated (p) and total p38, and ERK1/2 in cytosolic extracts were detected by Western blot. Densitometric values (means ± SEMs) are expressed relative to expression in unstimulated monocytes transfected with Scr siRNA. Data represent means ± SEMs of five independent experiments. *P < 0.05.
Fig. S6.
Fig. S6.
MIF does not compensate for MEK inhibition in newborn monocytes. Newborn monocytes were incubated with recombinant MIF (100–200 ng/mL) with or without the MEK inhibitor PD 98059 (50 µM) for 1 h before stimulation with E. coli (107 bacteria/mL). TNF levels were measured by ELISA in cell culture supernatants collected after 18 h. Data represent means ± SEMs of three independent experiments performed in triplicates. *P < 0.05 versus control.
Fig. 7.
Fig. 7.
MIF overrides the antiinflammatory effects of adenosine and PGE2. Newborn monocytes were incubated for 1 h with or without adenosine (10−6 M), PGE2 (10−8 M), hydrocortisone (HCZ, 10−7 M), or IB-MECA (a selective agonist of the adenosine A3 receptor; 10−6 M) and rhMIF (rhMIF 100 ng/mL unless specified otherwise). Cells were stimulated with E. coli for 18 h (A and B), 15–60 min (C and D), or 30 min (E). TNF concentrations were measured by ELISA in cell culture supernatants (A and B). Results are expressed in ng/mL (A) or as percent of E. coli-induced TNF release (B). Data represent means ± SEMs of 4–5 independent experiments performed in triplicates. *P < 0.05 (A); *P < 0.05 versus monocytes incubated with IB-MECA but not rhMIF (B); P < 0.05 versus monocytes incubated with PGE2 but not rhMIF (B). Phosphorylated (p) and total ERK1/2 in cytosolic extracts were analyzed by Western blot (C–E). Densitometric values (means ± SEMs of four independent experiments) are expressed relative to expression in unstimulated monocytes. *P < 0.05.
Fig. S7.
Fig. S7.
Adenosine, PGE2, and hydrocortisone dose-dependently inhibit E. coli-induced TNF production in newborn monocytes. Newborn monocytes were incubated for 1 h with or without adenosine (10−7 to 10−5 M, gray bars), PGE2 (10−10 to 10−8 M, black bars), or hydrocortisone (HCZ, 10−8 to 10−6 M, hatched bars) before stimulation with E. coli for 18 h. TNF concentrations were measured by ELISA in cell culture supernatants. Results are expressed as percent TNF release versus that for cells stimulated without adenosine, PGE2, and HCZ (control). Data represent means ± SEMs of 3–5 independent experiments performed in triplicates. *P < 0.05 versus cells stimulated in the absence of adenosine, PGE2, or HCZ.
Fig. S8.
Fig. S8.
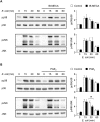
Impact of adenosine A3 receptor activation and PGE2 on E. coli-induced MAPK activation. Newborn monocytes were incubated for 1 h with or without IB-MECA, a selective agonist of the adenosine A3 receptor (10−6 M, A), or PGE2 (10−8 M, B), before stimulation with E. coli for 0, 15, 30, and 60 min. Phosphorylated (p) and total p38 and JNK in cytosolic extracts were analyzed by Western blot. Densitometric values (means ± SEMs of 3–4 independent experiments) are expressed relative to expression in unstimulated monocytes. *P < 0.05.
Fig. S9.
Fig. S9.
Newborn mice express high levels of MIF and are protected from sepsis by ISO-1. Blood was collected from C57BL6/N mice on postnatal day 0–1 (n = 7), 1–2 (n = 6), 5–6 (n = 13), and 50–60 (n = 16) to quantify MIF levels by ELISA (A). One- to two-day-old newborn mice were treated with ISO-1 (100 mg/kg intraperitoneally) or DMSO at the same time (B and C), 2 hours prior and at the same time (D), or 2 hours prior (E) an intraperitoneal challenge (B and C, 330 cfu; D, 150 cfu) or an intranasal challenge (E, 30 cfu) with E. coli. Sixteen hours later, mice were sacrificed to assess bacterial burden (B and E) and plasma concentrations of TNF, IL-6, IL-12p70, and RANTES (C). Survival was recorded after 24 hours (D). The median and the interquartile range are shown. *P < 0.05 vs. day 5–6 and day 50–60 (A). *P < 0.05 (B–E).
Fig. S10.
Fig. S10.
Model for MIF-mediated control of neonatal innate immune responses. Adenosine, prostaglandins, and steroid hormones are present at high levels in the fetal and neonatal circulation and reduce the capacity of newborn monocytes to activate ERK1/2 MAPK (for adenosine and PGE2) and NF-κB signaling (for steroids), and TNF production upon exposure to microbial products. We suggest a model in which, under the influence of steroid hormones, elevated levels of MIF in the neonatal circulation and in newborn monocytes contribute to sustain MAPK signaling in response to microbial products and antagonize adenosine and PGE2-mediated inhibition of ERK1/2 activation and TNF production. Red and green vertical arrows reflect mediator and cytokine fluctuations compared with adults. The equal sign indicates no difference in expression levels compared with adults.

Similar articles

Cited by

References

    1. Stoll BJ, et al. Eunice Kennedy Shriver National Institute of Child Health and Human Development Neonatal Research Network Early onset neonatal sepsis: The burden of group B Streptococcal and E. coli disease continues. Pediatrics. 2011;127(5):817–826. - PMC - PubMed
    1. Giannoni E, et al. Swiss Pediatric Sepsis Study Group Incidence and outcome of group B streptococcal sepsis in infants in Switzerland. Pediatr Infect Dis J. 2016;35(2):222–224. - PubMed
    1. Levy O. Innate immunity of the newborn: Basic mechanisms and clinical correlates. Nat Rev Immunol. 2007;7(5):379–390. - PubMed
    1. Kollmann TR, et al. Neonatal innate TLR-mediated responses are distinct from those of adults. J Immunol. 2009;183(11):7150–7160. - PMC - PubMed
    1. Aksoy E, et al. Interferon regulatory factor 3-dependent responses to lipopolysaccharide are selectively blunted in cord blood cells. Blood. 2007;109(7):2887–2893. - PubMed

Publication types

Substances

LinkOut - more resources