. 2016 Feb 23;113(8):2140-5.
doi: 10.1073/pnas.1525677113. Epub 2016 Feb 8.

Early and multiple origins of metastatic lineages within primary tumors

Affiliations

Early and multiple origins of metastatic lineages within primary tumors

Zi-Ming Zhao et al. Proc Natl Acad Sci U S A. .

Abstract

Many aspects of the evolutionary process of tumorigenesis that are fundamental to cancer biology and targeted treatment have been challenging to reveal, such as the divergence times and genetic clonality of metastatic lineages. To address these challenges, we performed tumor phylogenetics using molecular evolutionary models, reconstructed ancestral states of somatic mutations, and inferred cancer chronograms to yield three conclusions. First, in contrast to a linear model of cancer progression, metastases can originate from divergent lineages within primary tumors. Evolved genetic changes in cancer lineages likely affect only the proclivity toward metastasis. Single genetic changes are unlikely to be necessary or sufficient for metastasis. Second, metastatic lineages can arise early in tumor development, sometimes long before diagnosis. The early genetic divergence of some metastatic lineages directs attention toward research on driver genes that are mutated early in cancer evolution. Last, the temporal order of occurrence of driver mutations can be inferred from phylogenetic analysis of cancer chronograms, guiding development of targeted therapeutics effective against primary tumors and metastases.

Keywords: ancestral reconstruction; cancer; chronograms; oncogenes; tumor phylogenetics.


Conflict of interest statement

The authors declare no conflict of interest.

Figures
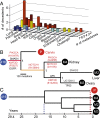
Fig. 1.
Fig. 1.
Tumor samples and methodology. (A) Cancer type and number of metastases analyzed for 40 subjects in our study. (B) Maximum likelihood tree of normal tissue (blue circle, 416), primary tumor of the cervix (red circle, P), and metastatic tumors (black circles, M2, M3, and M4) from subject 416, with a horizontal scale proportional to the number of mutations, and with all known driver mutations mapped to branches. The red internode represents the lineage ancestral to the primary tumor and all metastases. The orange internode represents the lineage ancestral to all metastases but not to the primary tumor. Genes in red have more than one mutation occurring on multiple branches; mutation locations are indicated in parentheses. Numbers at each internode indicate the statistical support for the corresponding branch (1 means 100% support). (C) Inferred cancer chronogram for subject 416, scaled in years, encompassing the first genetic divergence from Normal sequence (29.4 y), the first genetic divergence of metastases (17 y, blue dashes), and the diagnosis time (8 mo, red dashes). The phylogeny for subject 416 exhibited a diversity of cancer driver mutations occurring across multiple branches.
Fig. S1.
Fig. S1.
Tumor samples and methodology. (A) Formalin-fixed paraffin-embedded (FFPE) cored samples of normal, primary, and metastatic tumor tissue from one patient (427). (B) Coverage of targeted bases at 20× or greater (% of bases, orange points) and sequencing coverage (% of reads mapping to genome, blue points; % of reads mapping to targeted exome, red points). Error bars indicate ±1 SD, except tumor purity (%, yellow) of primary and metastatic tumors, for which error bars indicate the 25th and 75th percentile of the empirical distribution.
Fig. S2.
Fig. S2.
Maximum likelihood evolutionary trees for each of the 40 subjects, aligned with the genomic LOH (blue lines). The blue circle labeled with the subject ID number represents the normal tissue, the red circle labeled “P” represents the primary tumor, and the black circles represent metastatic tumors (“M1”, “M2”, “M3”, etc.). Internodes are scaled to be proportional to the number of mutations. Bootstrap branch support is reported at corresponding internal nodes. LOH is plotted with gray dashed lines indicating divisions between chromosomes. Red bars on the LOH plots indicate nonsilent mutations in driver genes. Yellow bars indicate insertions or deletions in driver genes.
Fig. S3.
Fig. S3.
Chronograms with diagnosis (red dashed line), biopsy, and resection times. Gray dashed lines indicate the times of inferred genetic divergences of tumors. The blue violin plots indicate the 95% central interquartile distribution of branching times for each node.
Fig. 2.
Fig. 2.
Four maximum likelihood cancer molecular evolutionary trees, with a horizontal scale proportional to the number of mutations. (A) Subject 424 had a colon primary tumor and metastases to the duodenum (M1) and liver (M2). The primary tumor was an ingroup to all metastases in 80.4% of the Bayesian posterior of trees for subject 424. (B) Subject 446 had a pancreatic adenocarcinoma primary tumor and metastases to the kidney (M2), bowel (M3), and liver (M4). The primary tumor was an outgroup to all metastases in 99.8% of the Bayesian posterior of trees for subject 446. (C) Subject 435 had a poorly differentiated lung adenocarcinoma primary tumor and metastases to the lung (M0), liver (M1), pancreas (M3), hilar lymph node (M4), paraprostatic soft tissue (M5), perirenal soft tissue (M6), and mediastinum (M7). The primary tumor was an outgroup to all metastases in 100% of the Bayesian posterior of trees for subject 435. (D) Subject 459 had a lung adenocarcinoma primary tumor and metastases to the lung (M1), liver (M2), spleen (M3), kidney (M4), adrenal (M5) and paratracheal lymph node (M6). The primary tumor was an outgroup to all metastases in 100% of the Bayesian posterior of trees for subject 459.
Fig. 3.
Fig. 3.
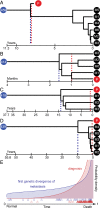
Timings of the first genetic divergence from normal tissue sequence (blue circle), of the first genetic divergence of metastases (blue dashes) and of diagnosis (red dashes) during tumor progression. (A) Subject 459 (lung adenocarcinoma, aged 54 y at death) provided an example of early diagnosis of the primary tumor without diagnosis of metastases, but also early divergence of the metastases. (BD) Subjects 414 (lung, large cell, aged 25 y), 418 (ovarian, aged 47 y), and 439 (renal clear cell carcinoma, aged 58 y) provided examples of late metastasis in which diagnosis of the primary tumor and metastases occurred after the first genetic divergence of metastasis. (E) Probability density for the occurrence of the first genetic divergence of metastases and for the time of diagnosis. The x axis is scaled from 0 (the first genetic divergence of primary tumor tissue from normal tissue) to 1 (death). In our set of 40 lethal cancers, the first genetic divergences of metastatic lineages (blue triangles) are distributed so as to often occur earlier than diagnosis time (red triangles).
Fig. 4.
Fig. 4.
Inferred distributions of the temporal occurrence of mutations (∆) in cancer driver genes KRAS (dark purple line, no shading), TP53 (black line, gray shading), PIK3CA (olive line, olive shading), KMT2D (medium purple line, no shading), ALK (light gray line, light gray shading), and KMT2C (light purple line, no shading) across diverse cancer types. Probability densities for the appearance of alleles with nonsilent mutations across these cases indicate that mutations of KRAS and TP53 tend to occur earlier than mutations of PIK3CA or KMT2D (P < 0.001), which, in turn, tend to occur earlier than mutations of ALK or KMT2C (P < 0.001). Mutations are depicted at the midpoint of the interval during which the gene was inferred to be mutated in the particular subject.
Fig. S4.
Fig. S4.
Base calling approach. At a given site, the read counts for the four nucleotides are labeled A, B, C, and D, in descending order of frequency. The lower bound of the multinomial 95% confidence intervals are denoted Amin, Bmin, and Cmin, respectively (the least frequent nucleotide read count, D, is ignored). Where these values equal zero (i.e., the confidence interval overlaps zero), we treat the signal for the corresponding nucleotide as noise. The final call, as reference, alternative, or missing, is deduced.

References

    1. Gerlinger M, et al. Genomic architecture and evolution of clear cell renal cell carcinomas defined by multiregion sequencing. Nat Genet. 2014;46(3):225–233. - PMC - PubMed
    1. Weinberg RA. Tumor suppressor genes. Science. 1991;254(5035):1138–1146. - PubMed
    1. Harbst K, et al. Molecular and genetic diversity in the metastatic process of melanoma. J Pathol. 2014;233(1):39–50. - PMC - PubMed
    1. Nguyen DX, Bos PD, Massagué J. Metastasis: From dissemination to organ-specific colonization. Nat Rev Cancer. 2009;9(4):274–284. - PubMed
    1. Lawrence MS, et al. Mutational heterogeneity in cancer and the search for new cancer-associated genes. Nature. 2013;499(7457):214–218. - PMC - PubMed

Publication types