. 2016 Jan 28:9:5.
doi: 10.3389/fnmol.2016.00005. eCollection 2016.

Bicarbonate and Ca(2+) Sensing Modulators Activate Photoreceptor ROS-GC1 Synergistically

Affiliations

Bicarbonate and Ca(2+) Sensing Modulators Activate Photoreceptor ROS-GC1 Synergistically

Teresa Duda et al. Front Mol Neurosci. .

Abstract

Photoreceptor ROS-GC1, a prototype subfamily member of the membrane guanylate cyclase family, is a central component of phototransduction. It is a single transmembrane-spanning protein, composed of modular blocks. In rods, guanylate cyclase activating proteins (GCAPs) 1 and 2 bind to its juxtamembrane domain (JMD) and the C-terminal extension, respectively, to accelerate cyclic GMP synthesis when Ca(2+) levels are low. In cones, the additional expression of the Ca(2+)-dependent guanylate cyclase activating protein (CD-GCAP) S100B which binds to its C-terminal extension, supports acceleration of cyclic GMP synthesis at high Ca(2+) levels. Independent of Ca(2+), ROS-GC1 activity is also stimulated directly by bicarbonate binding to the core catalytic domain (CCD). Several enticing molecular features of this transduction system are revealed in the present study. In combination, bicarbonate and Ca(2+)-dependent modulators raised maximal ROS-GC activity to levels that exceeded the sum of their individual effects. The F(514)S mutation in ROS-GC1 that causes blindness in type 1 Leber's congenital amaurosis (LCA) severely reduced basal ROS-GC1 activity. GCAP2 and S100B Ca(2+) signaling modes remained functional, while the GCAP1-modulated mode was diminished. Bicarbonate nearly restored basal activity as well as GCAP2- and S100B-stimulated activities of the F(514)S mutant to normal levels but could not resurrect GCAP1 stimulation. We conclude that GCAP1 and GCAP2 forge distinct pathways through domain-specific modules of ROS-GC1 whereas the S100B and GCAP2 pathways may overlap. The synergistic interlinking of bicarbonate to GCAPs- and S100B-modulated pathways intensifies and tunes the dependence of cyclic GMP synthesis on intracellular Ca(2+). Our study challenges the recently proposed GCAP1 and GCAP2 "overlapping" phototransduction model (Peshenko et al., 2015b).

Keywords: S100 proteins; bicarbonate; calcium-binding protein; guanylate cyclase (guanylyl cyclase); guanylate cyclase activating protein (GCAP); phototransduction; second messenger; signal transduction.


Figures
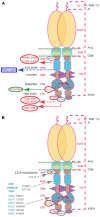
Figure 1
Figure 1
(A) Schematic representation of the structural domains of the ROS-GC1 homodimer. The dashed lines on the right outline the boundaries of its segments. LS, leader sequence that is absent in the mature form of the ROS-GC1 expressed in outer segments; ExtD, extracellular domain; TmD, transmembrane domain; IcD, intracellular domain. All functional signaling subdomains are housed in IcD; their designated names and the amino acids residues constituting their boundaries are indicated on the left. The binding sites for GCAP1, GCAP2, S100B, and bicarbonate are shown for one monomer but the ROS-GC1 dimer binds two GCAP1, two GCAP2, or two S100B subunits and is likely capable of binding at least two bicarbonate molecules irrespective of which Ca2+-sensing subunits are attached. The figure has been modified from Duda et al. (2015). The GCAP1 signal originates at the L503-I522 site in JMD and migrates downstream through the successive kinase homology domain (KHD) and signaling helix domain (SHD) to reach core catalytic domain (CCD), a central location for the translation of all the signals into cyclic GMP synthesis. Signals generated by GCAP2 and S100B originate from CTE (C-terminal extension) and migrate upstream to CCD to be translated. The 657WTAPELL663 motif is critical for the signaling of both GCAPs, however, it has no role in controlling the basal catalytic activity of the cyclase or in the binding of the GCAPs. In contrast to GCAP2 signaling, SHD is obligatory for GCAP1 signaling. Bicarbonate signals CCD activation independent of [Ca2+]. All other signaling mechanisms are sensitive to [Ca2+]. For clarity, the depicted domains are not proportional to the scale. (B) Mutations in ROS-GC1 that cause LCA (gray). The F514S mutation residing in the GCAP1-modulated region of the JMD disabled the basal catalytic activity and compromised regulation by GCAP1 but left the regulatory activities of the GCAP2, S100B, and bicarbonate intact. The D588Y and R717W mutations in the KHD reduce basal activity and prevent GCAP1 binding (Peshenko et al., 2010). The P807S and L903P mutations in the CCD lower basal activity and GCAPs-stimulated activities (Tucker et al., 2004). The other CCD mutations that cause LCA are thought to eradicate catalytis cativity (Rozet et al., 2001). The steric arrangements of the D834, E874, D878, R923, C946, and N953 residues of the CCD (blue-gray) are predicted to be negatively influenced by the LCA1-linked mutations. Note: the amino acid residue numbers reflect their positions in the mature bovine protein (Goraczniak et al., 1994).
Figure 2
Figure 2
Activation of recombinant WT and mutant F514S ROS-GC1 by bicarbonate. The experiments were done in triplicate and repeated five times; the 100 mM bicarbonate concentration was only included in two experiments. Collected results were fit with a Hill function: activity = basal activity + (maximal activity − basal activity)([bicarbonate]n/([bicarbonate]n + ED50n)), but symbols plot mean ± standard deviation for clarity. For the WT ROS-GC1, the Hill coefficient was 2.2 and the ED50 was 16 mM while for the F514S mutant, the Hill coefficient was 1.6 and the ED50 was 25 mM.
Figure 3
Figure 3
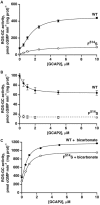
Residual effects of GCAP1 on the activity of recombinant F514S mutant ROS-GC1. Symbols with error bars plot mean ± standard deviation, but traces show fits of collected results to a Hill function (continuous lines). (A) Stimulation of ROS-GC1 and its F514S mutant by GCAP1 in the presence of 1 mM EGTA (nominally 10 nM Ca2+). For WT ROS-GC1, the change in activity was 5.7-fold, the Hill coefficient was 2.0 and the ED50 was 0.8 μM. For the mutant, the change in activity was approximately 1.7-fold. Experiments were done in triplicate and repeated three times for WT and four times for the mutant. (B) Collected results for F514S ROS-GC1 from (A) plotted on a rescaled ordinate. Linear regression (dashed line) yielded a slope that differed significantly from zero, p < 0.003. (C) GCAP1 inhibition of ROS-GC1 but not of the F514S mutant at high, 2 μM Ca2+. Continuous trace shows a fit of the WT ROS-GC1 scatter plot with a Hill function: activity = (maximal activity − minimal activity)/(1 + ([GCAP1]/ED50)n) + minimal activity. Activity decreased by 1.3-fold, the Hill coefficient was 2.7, and the ED50 was 0.8 μM. The slope obtained from a linear regression analysis of F514S results was not significant, so the dashed trace shows a horizontal line with an intercept of 11.5, the mean of all F514S values. Experiments were done in triplicate and repeated twice. (D) Potentiated GCAP1 activation of ROS-GC1 but not the F514S mutant by bicarbonate. In the presence of 1 mM EGTA, 50 mM bicarbonate and indicated concentrations of GCAP1, activity of the WT ROS-GC1 climbed 2.7-fold whereas that of the F514S mutant increased ~1.2-fold. For the WT ROS-GC1, the Hill coefficient was 1.4 and the ED50 was 0.6 μM. The experiments were done in triplicate and repeated three times.
Figure 4
Figure 4
GCAP2 effect on the activity of recombinant F514S mutant of ROS-GC1. (A) GCAP2-stimulated activities of ROS-GC1 and its F514S mutant at low Ca2+. Vmax for WT ROS-GC1 was 5.7-fold greater than the basal activity, the Hill coefficient was 1.6 and the ED50 was 1.6 μM. For the mutant, activity increased 9.3-fold, the Hill coefficient was 1.1 and the ED50 was 1.9 μM. (B) GCAP2 inhibition of ROS-GC1 but not the F514S mutant at high, 2 μM Ca2+. For WT ROS-GC1, the decrease in activity was 1.6-fold, Hill coefficient was 1.2 and ED50 was 0.7 μM. The slope from a linear regression of the results for F514S was not significant. The dashed line has a slope of zero and an intercept of 14 pmol cGMP min−1 (mg prot)−1 which was the mean of all F514S values. (C) Bicarbonate potentiated GCAP2 activation of ROS-GC1 and of the F514S mutant. With 50 mM bicarbonate, 1 mM EGTA and increasing concentrations of GCAP2, WT ROS-GC1 activity increased 3.2-fold with a Hill coefficient of 1.6 and an ED50 of 0.7 μM, whereas for F514S ROS-GC1, activity increased 3.5-fold with a Hill coefficient of 1.6 and ED50 of 0.8 μM. The experiments were done in triplicate and repeated three times.
Figure 5
Figure 5
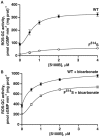
Retention of S100B activation by the F514S mutant in the absence of (A) and in the presence of (B) bicarbonate. One micromolar Ca2+ was present in the assay mixture. The experiments were done in triplicate and repeated three times. In the absence of bicarbonate, activation by S100B was 3.7-fold for WT ROS-GC1 with a Hill coefficient of 1.9 and an ED50 of 0.6 μM, whereas for the mutant, activation was 5.7-fold with a Hill coefficient of 1.5 and an ED50 of 1.0 μM. With the addition of 50 mM bicarbonate, activation of WT ROS-GC1 by S100B was 2.9-fold, the Hill coefficient was 0.9 and ED50 was 0.6 μM. For the mutant, activation was 3.6-fold, the Hill coefficient was 1.8 and ED50 was 0.7 μM.
Figure 6
Figure 6
Synergistic regulation of native ROS-GC activity by GCAPs and bicarbonate. Outer segment membranes of GCAPs−/− and GCAPs+/+ mice were assayed for guanylate cyclase activity in the presence of 1 mM EGTA with or without 50 mM bicarbonate. The column labeled “additive” plots the GCAPs+/+ activity at low Ca2+ plus the GCAPs−/− with bicarbonate activity minus the basal GCAPs−/− activity. Error bars show standard deviations. The experiment was done in triplicate and repeated two times.
Figure 7
Figure 7
Synergy of GCAPs and bicarbonate in stimulating ROS-GC1 activity determined through reconstitution. Guanylate cyclase activity of GCAPs−/− mouse outer segment membranes increased after reconstitution with 4 μM each of GCAP1 and GCAP2. The addition of 50 mM raised activity in the presence of GCAPs to a level that was higher than predicted from summing the individual effects of GCAPs and bicarbonate (“additive”). One mM EGTA was present in the assay mixture. The experiment was done in triplicate and repeated two times.
Figure 8
Figure 8
Synergistic regulation of ROS-GC activity in the membranes of murine outer segments by S100B and bicarbonate. The guanylate cyclase activity of outer segment membranes from S100B−/− and S100B+/+ control mice with a combination of 2 μM S100B and 50 mM bicarbonate in the presence of 1 μM Ca2+ surpassed the sum (“add”) of the activities obtained with S100B and bicarbonate applied separately. The experiment was done in triplicate and repeated two times.

Similar articles

Cited by

References

    1. Anantharaman V., Balaji S., Aravind L. (2006). The signaling helix: a common functional theme in diverse signaling proteins. Biol. Direct. 1:25. 10.1186/1745-6150-1-25 - DOI - PMC - PubMed
    1. Boye S. E. (2015). Leber congenital amaurosis caused by mutations in GUCY2D. Cold Spring Harb. Perspect. Med. 5:a017350. 10.1101/cshperspect.a017350 - DOI - PMC - PubMed
    1. Broeders G. C., Parmer R., Dawson W. W. (1988). Electroretinal changes in the presence of a carbonic anhydrase inhibitor. Ophthalmologica 196, 103–110. 10.1159/000309884 - DOI - PubMed
    1. Carter-Dawson L. D., LaVail M. M. (1979). Rods and cones in the mouse retina. I. Structural analysis using light and electron microscopy. J. Comp. Neurol. 188, 245–262. 10.1002/cne.901880204 - DOI - PubMed
    1. Donner K., Hemilä S., Kalamkarov G., Koskelainen A., Shevchenko T. (1990). Rod phototransduction modulated by bicarbonate in the frog retina: roles of carbonic anhydrase and bicarbonate exchange. J. Physiol. 426, 297–316. 10.1113/jphysiol.1990.sp018139 - DOI - PMC - PubMed

LinkOut - more resources