

Anticonvulsant Effect of Time-Restricted Feeding in a Pilocarpine-Induced Seizure Model: Metabolic and Epigenetic Implications
- PMID: 26858603
- PMCID: PMC4730902
- DOI: 10.3389/fncel.2016.00007
Anticonvulsant Effect of Time-Restricted Feeding in a Pilocarpine-Induced Seizure Model: Metabolic and Epigenetic Implications
Abstract
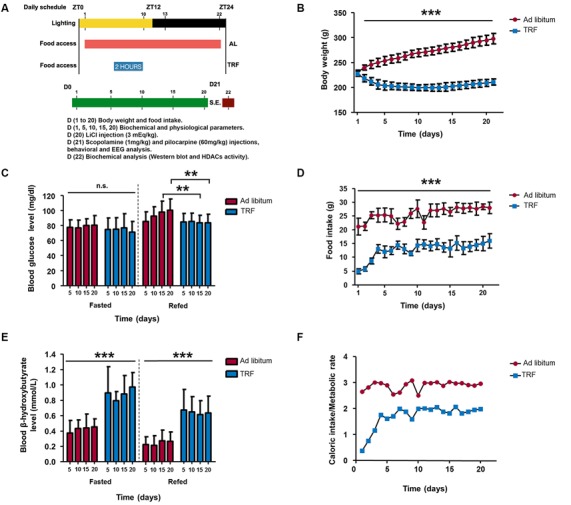
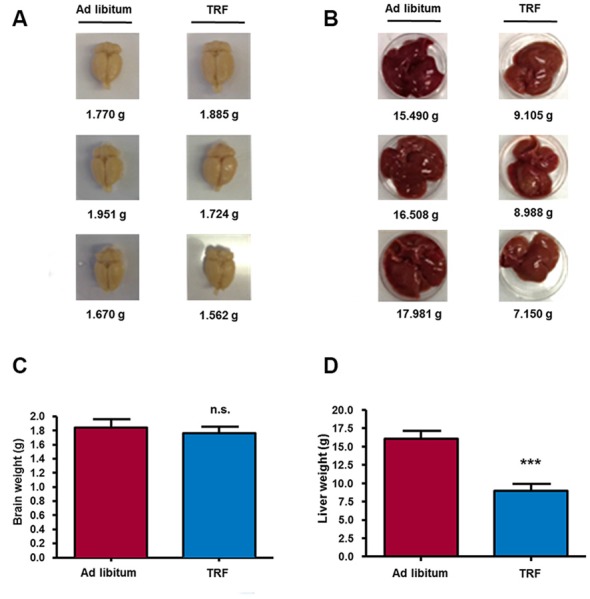
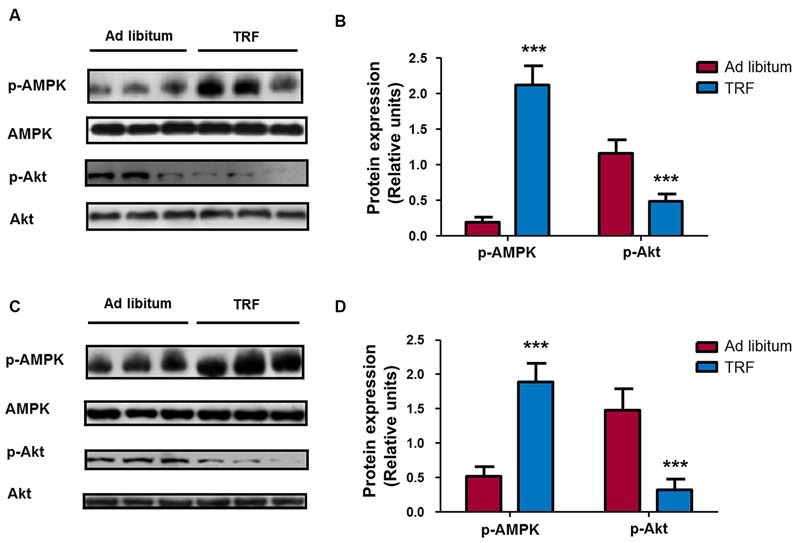
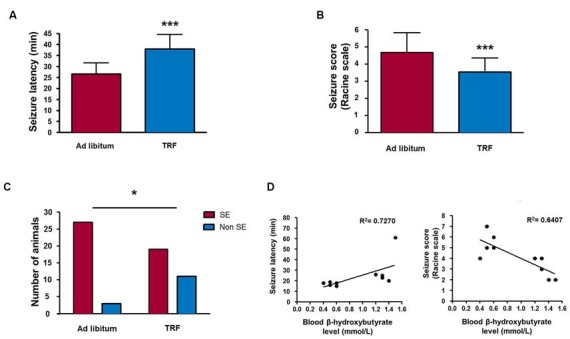
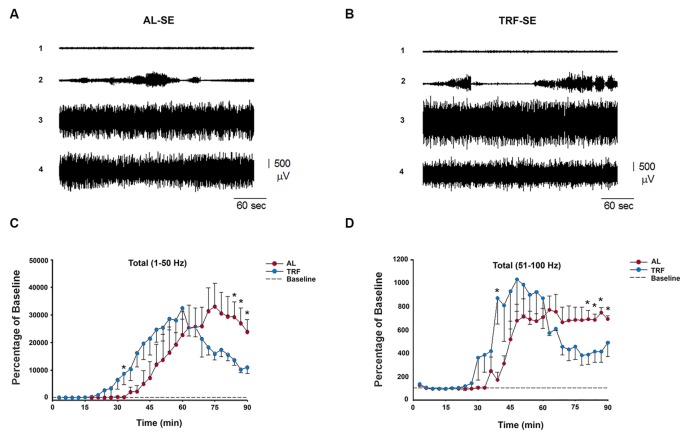
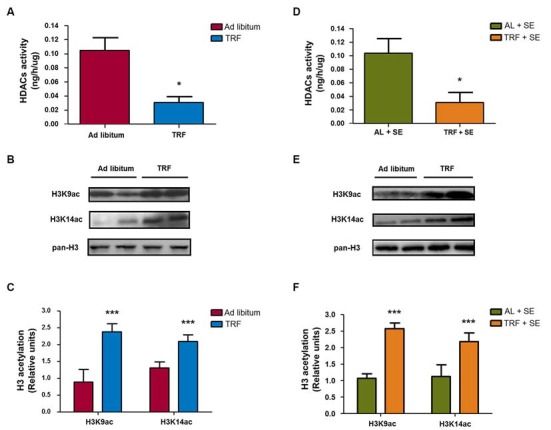
A new generation of antiepileptic drugs has emerged; however, one-third of epilepsy patients do not properly respond to pharmacological treatments. The purpose of the present study was to investigate whether time-restricted feeding (TRF) has an anticonvulsant effect and whether this restrictive diet promotes changes in energy metabolism and epigenetic modifications in a pilocarpine-induced seizure model. To resolve our hypothesis, one group of rats had free access to food and water ad libitum (AL) and a second group underwent a TRF schedule. We used the lithium-pilocarpine model to induce status epilepticus (SE), and behavioral seizure monitoring was analyzed. Additionally, an electroencephalography (EEG) recording was performed to verify the effect of TRF on cortical electrical activity after a pilocarpine injection. For biochemical analysis, animals were sacrificed 24 h after SE and hippocampal homogenates were used to evaluate the proteins related to metabolism and chromatin structure. Our results showed that TRF had an anticonvulsant effect as measured by the prolonged latency of forelimb clonus seizure, a decrease in the seizure severity score and fewer animals reaching SE. Additionally, the power of the late phase EEG recordings in the AL group was significantly higher than the TRF group. Moreover, we found that TRF is capable of inducing alterations in signaling pathways that regulate energy metabolism, including an increase in the phosphorylation of AMP dependent kinase (AMPK) and a decrease in the phosphorylation of Akt kinase. Furthermore, we found that TRF was able to significantly increase the beta hydroxybutyrate (β-HB) concentration, an endogenous inhibitor of histone deacetylases (HDACs). Finally, we found a significant decrease in HDAC activity as well as an increase in acetylation on histone 3 (H3) in hippocampal homogenates from the TRF group. These findings suggest that alterations in energy metabolism and the increase in β-HB mediated by TRF may inhibit HDAC activity, thus increasing histone acetylation and producing changes in the chromatin structure, which likely facilitates the transcription of a subset of genes that confer anticonvulsant activity.
Keywords: AMP kinase; Akt kinase; HDACs inhibition; anticonvulsant; beta-hydroxybutyrate; histone 3 acetylation; pilocarpine.
Figures
Similar articles
-
Transient anticonvulsant effects of time-restricted feeding in the 6-Hz mouse model.Epilepsy Behav. 2024 Feb;151:109618. doi: 10.1016/j.yebeh.2023.109618. Epub 2024 Jan 6. Epilepsy Behav. 2024. PMID: 38184948
-
Rapid changes in expression of class I and IV histone deacetylases during epileptogenesis in mouse models of temporal lobe epilepsy.Exp Neurol. 2015 Nov;273:92-104. doi: 10.1016/j.expneurol.2015.07.026. Epub 2015 Jul 31. Exp Neurol. 2015. PMID: 26238735
-
Age dependence of pilocarpine-induced status epilepticus and inhibition of CaM kinase II activity in the rat.Brain Res Dev Brain Res. 2005 Apr 21;156(1):67-77. doi: 10.1016/j.devbrainres.2005.02.001. Brain Res Dev Brain Res. 2005. PMID: 15862629
-
Behavioral and histological assessment of the effect of intermittent feeding in the pilocarpine model of temporal lobe epilepsy.Epilepsy Res. 2009 Sep;86(1):54-65. doi: 10.1016/j.eplepsyres.2009.05.003. Epub 2009 Jun 7. Epilepsy Res. 2009. PMID: 19505798
-
[Epigenetic mechanisms and alcohol use disorders: a potential therapeutic target].Biol Aujourdhui. 2017;211(1):83-91. doi: 10.1051/jbio/2017014. Epub 2017 Jul 6. Biol Aujourdhui. 2017. PMID: 28682229 Review. French.
Cited by
-
Regulation of Ketone Body Metabolism and the Role of PPARα.Int J Mol Sci. 2016 Dec 13;17(12):2093. doi: 10.3390/ijms17122093. Int J Mol Sci. 2016. PMID: 27983603 Free PMC article. Review.
-
Sub-Convulsing Dose Administration of Pilocarpine Reduces Glycemia, Increases Anxiety-Like Behavior and Decelerates Cortical Spreading Depression in Rats Suckled on Various Litter Sizes.Front Neurosci. 2018 Dec 3;12:897. doi: 10.3389/fnins.2018.00897. eCollection 2018. Front Neurosci. 2018. PMID: 30559645 Free PMC article.
-
The Effects of Dietary Interventions on Brain Aging and Neurological Diseases.Nutrients. 2022 Nov 30;14(23):5086. doi: 10.3390/nu14235086. Nutrients. 2022. PMID: 36501116 Free PMC article. Review.
-
Fasting as a Therapy in Neurological Disease.Nutrients. 2019 Oct 17;11(10):2501. doi: 10.3390/nu11102501. Nutrients. 2019. PMID: 31627405 Free PMC article. Review.
-
Intermittent fasting, fatty acid metabolism reprogramming, and neuroimmuno microenvironment: mechanisms and application prospects.Front Nutr. 2024 Oct 24;11:1485632. doi: 10.3389/fnut.2024.1485632. eCollection 2024. Front Nutr. 2024. PMID: 39512520 Free PMC article. Review.
References
LinkOut - more resources
Full Text Sources
Other Literature Sources