Distribution of 28 kDa Calbindin-Immunopositive Neurons in the Cat Spinal Cord
- PMID: 26858610
- PMCID: PMC4729936
- DOI: 10.3389/fnana.2015.00166
Distribution of 28 kDa Calbindin-Immunopositive Neurons in the Cat Spinal Cord
Erratum in
-
Corrigendum: Distribution of 28 kDa Calbindin-Immunopositive Neurons in the Cat Spinal Cord.Front Neuroanat. 2016 Dec 22;10:126. doi: 10.3389/fnana.2016.00126. eCollection 2016. Front Neuroanat. 2016. PMID: 28018184 Free PMC article.
Abstract
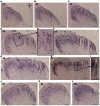
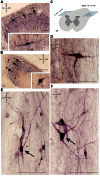
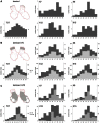
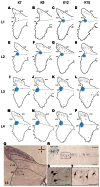
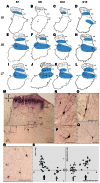
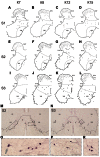
The distribution of vitamin D-dependent calcium-binding protein (28 kDa calbindin) was investigated in cat lumbar and sacral spinal cord segments (L1-S3). We observed specific multi-dimensional distributions over the spinal segments for small immunopositive cells in Rexed laminae II-III and medium-to-large cells of varying morphology in lamina I and laminae V-VIII. The small neurons in laminae II-III were clustered into the columns along the dorsal horn curvature. The medium-to-large cells were grouped into four assemblages that were located in (1) the most lateral region of lamina VII at the L1-L4 level; (2) the laminae IV-V boundary at the L5-L7 level; (3) the lamina VII dorsal border at the L5-L7 level; and (4) the lamina VIII at the L5-S3 level. The data obtained suggest that the morphological and physiological heterogeneity of calbindin immunolabeling cells formed morpho-functional clusters over the gray matter. A significant portion of the lumbosacral enlargement had immunopositive neurons within all Rexed laminae, suggesting an important functional role within and among the spinal networks that control hindlimb movements.
Keywords: Ca2+-binding proteins; calbindin-28 kDa; gray matter; interneurons; spinal cord.
Figures


Similar articles
-
The calcium binding proteins calbindin, parvalbumin, and calretinin have specific patterns of expression in the gray matter of cat spinal cord.J Neurocytol. 2005 Dec;34(6):369-85. doi: 10.1007/s11068-006-8724-2. Epub 2006 Aug 10. J Neurocytol. 2005. PMID: 16902759
-
Field potential mapping of neurons in the lumbar spinal cord activated following stimulation of the mesencephalic locomotor region.J Neurosci. 1995 Mar;15(3 Pt 2):2203-17. doi: 10.1523/JNEUROSCI.15-03-02203.1995. J Neurosci. 1995. PMID: 7891162 Free PMC article.
-
Development of calbindin-D28k immunoreactive neurons in the embryonic chick lumbosacral spinal cord.Eur J Neurosci. 1993 Jul 1;5(7):782-94. doi: 10.1111/j.1460-9568.1993.tb00930.x. Eur J Neurosci. 1993. PMID: 8281290
-
A comparative study of the calcium-binding proteins calbindin-D28K, calretinin, calmodulin and parvalbumin in the rat spinal cord.Brain Res Brain Res Rev. 1994 May;19(2):163-79. doi: 10.1016/0165-0173(94)90010-8. Brain Res Brain Res Rev. 1994. PMID: 8061685 Review.
-
Traumatic injury of the spinal cord and nitric oxide.Prog Brain Res. 2007;161:171-83. doi: 10.1016/S0079-6123(06)61011-X. Prog Brain Res. 2007. PMID: 17618976 Review.
Cited by
-
CAS: Cell Annotation Software - Research on Neuronal Tissue Has Never Been so Transparent.Neuroinformatics. 2017 Oct;15(4):365-382. doi: 10.1007/s12021-017-9340-2. Neuroinformatics. 2017. PMID: 28849545 Free PMC article.
-
Immunohistochemical distribution of secretagogin in the mouse brain.Front Neuroanat. 2023 Aug 30;17:1224342. doi: 10.3389/fnana.2023.1224342. eCollection 2023. Front Neuroanat. 2023. PMID: 37711587 Free PMC article.
-
Axonal Injury Induces ATF3 in Specific Populations of Sacral Preganglionic Neurons in Male Rats.Front Neurosci. 2018 Oct 24;12:766. doi: 10.3389/fnins.2018.00766. eCollection 2018. Front Neurosci. 2018. PMID: 30405344 Free PMC article.
-
The brain of the tree pangolin (Manis tricuspis). X. The spinal cord.J Comp Neurol. 2022 Oct;530(15):2692-2710. doi: 10.1002/cne.25350. Epub 2022 Jun 29. J Comp Neurol. 2022. PMID: 35765943 Free PMC article.
-
Neurochemical atlas of the rabbit spinal cord.Brain Struct Funct. 2024 Nov;229(8):2011-2027. doi: 10.1007/s00429-024-02842-z. Epub 2024 Aug 8. Brain Struct Funct. 2024. PMID: 39115602
References
-
- Antal M., Polgár E., Chalmers J., Minson J. B., Llewellyn-Smith I., Heizmann C. W., et al. . (1991). Different populations of parvalbumin- and calbindin-D28k-immunoreactive neurons contain GABA and accumulate 3H-D-Aspartatei in the dorsal horn of the rat spinal cord. J. Comp. Neurol. 314, 114–124. 10.1002/cne.903140111 - DOI - PubMed
LinkOut - more resources
Full Text Sources
Other Literature Sources
Miscellaneous

