. 2016 Jan 27:7:4.
doi: 10.3389/fendo.2016.00004. eCollection 2016.

Differential Effects of Camel Milk on Insulin Receptor Signaling - Toward Understanding the Insulin-Like Properties of Camel Milk

Affiliations

Differential Effects of Camel Milk on Insulin Receptor Signaling - Toward Understanding the Insulin-Like Properties of Camel Milk

Abdulrasheed O Abdulrahman et al. Front Endocrinol (Lausanne). .

Abstract

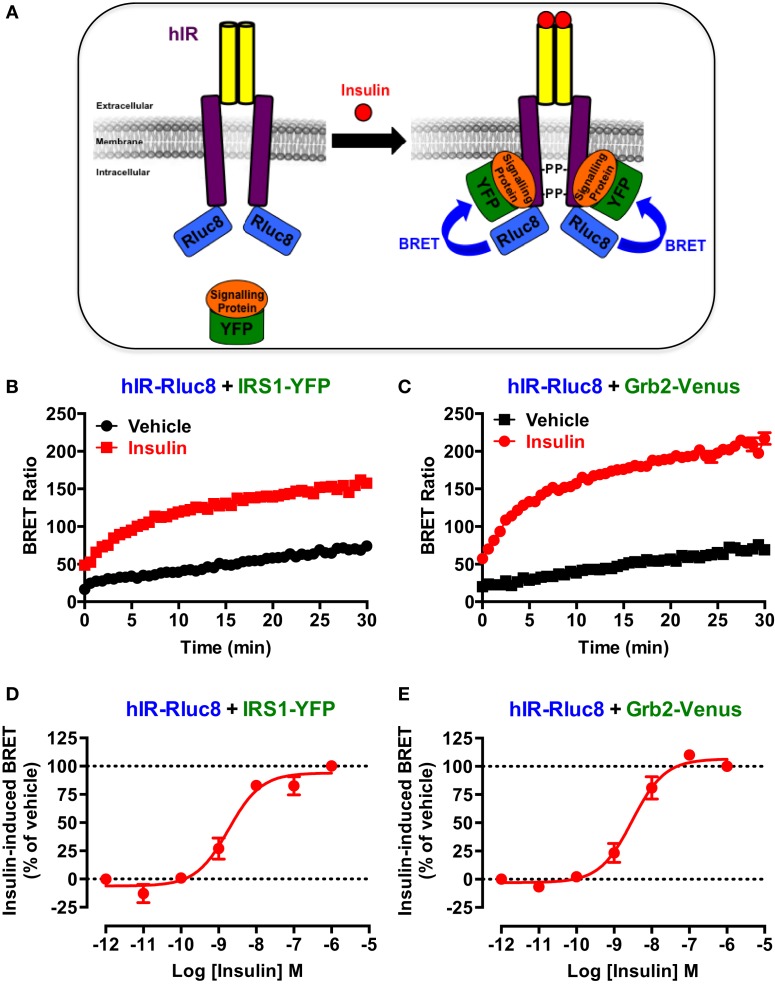
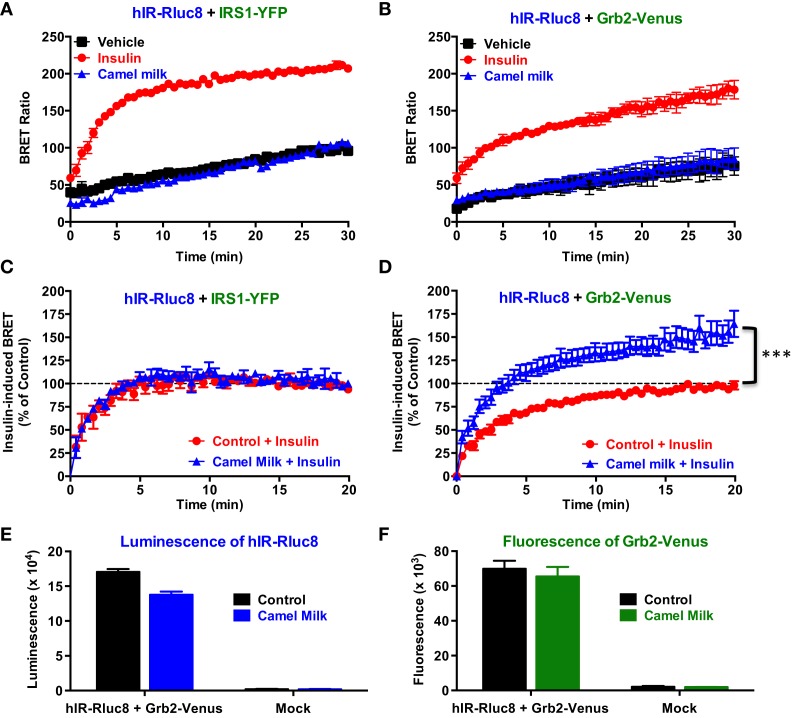
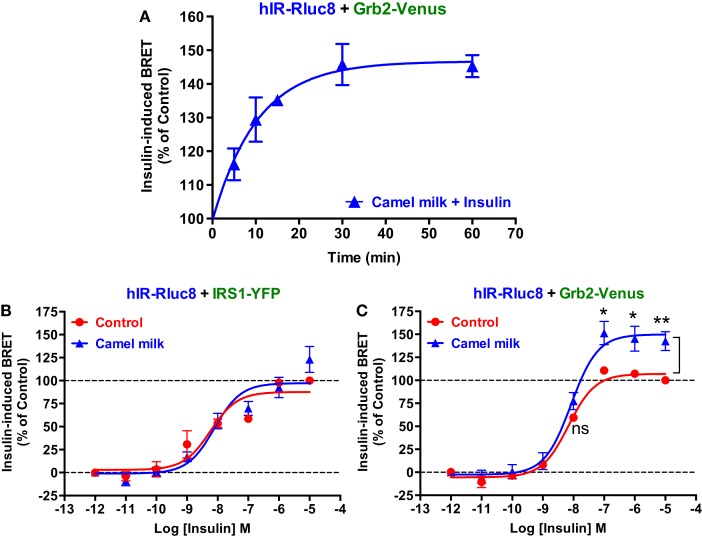
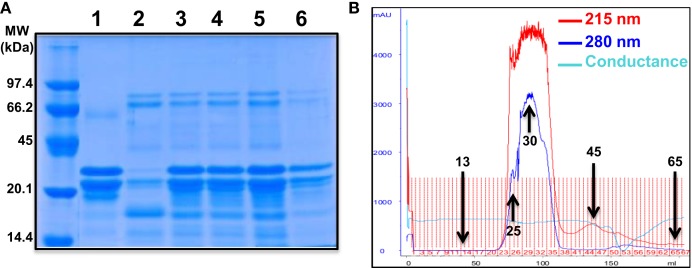
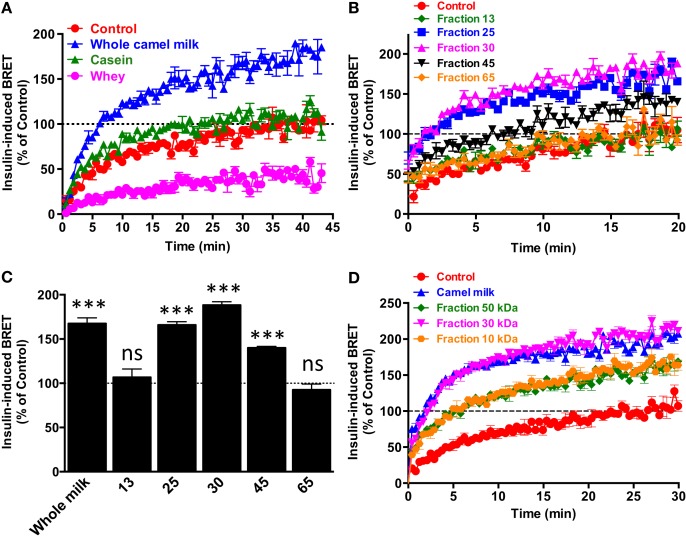
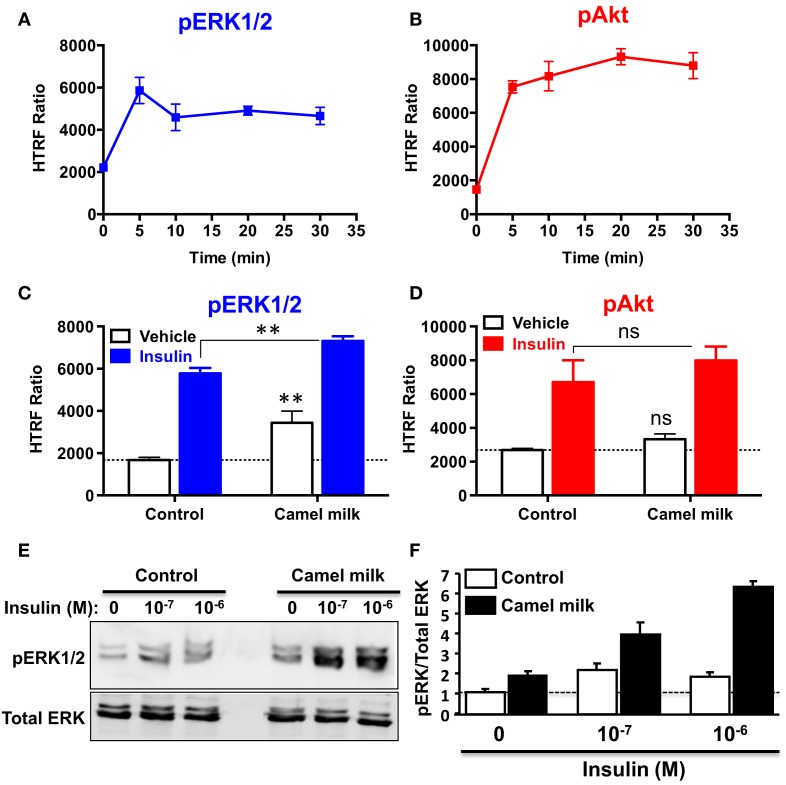
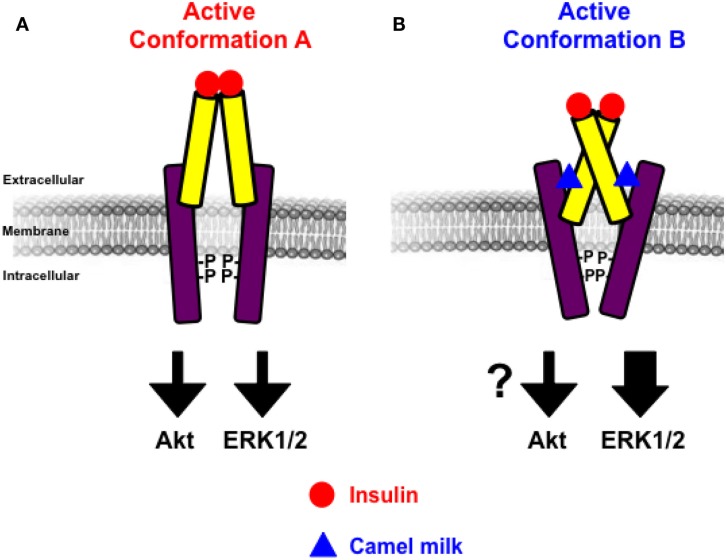
Previous studies on the Arabian camel (Camelus dromedarius) showed beneficial effects of its milk reported in diverse models of human diseases, including a substantial hypoglycemic activity. However, the cellular and molecular mechanisms involved in such effects remain completely unknown. In this study, we hypothesized that camel milk may act at the level of human insulin receptor (hIR) and its related intracellular signaling pathways. Therefore, we examined the effect of camel milk on the activation of hIR transiently expressed in human embryonic kidney 293 (HEK293) cells using bioluminescence resonance energy transfer (BRET) technology. BRET was used to assess, in live cells and real-time, the physical interaction between hIR and insulin receptor signaling proteins (IRS1) and the growth factor receptor-bound protein 2 (Grb2). Our data showed that camel milk did not promote any increase in the BRET signal between hIR and IRS1 or Grb2 in the absence of insulin stimulation. However, it significantly potentiated the maximal insulin-promoted BRET signal between hIR and Grb2 but not IRS1. Interestingly, camel milk appears to differentially impact the downstream signaling since it significantly activated ERK1/2 and potentiated the insulin-induced ERK1/2 but not Akt activation. These observations are to some extent consistent with the BRET data since ERK1/2 and Akt activation are known to reflect the engagement of Grb2 and IRS1 pathways, respectively. The preliminary fractionation of camel milk suggests the peptide/protein nature of the active component in camel milk. Together, our study demonstrates for the first time an allosteric effect of camel milk on insulin receptor conformation and activation with differential effects on its intracellular signaling. These findings should help to shed more light on the hypoglycemic activity of camel milk with potential therapeutic applications.

Keywords: Akt; BRET; ERK1/2; GRB2; IRS1; camel milk; insulin; insulin receptor.


Figures

Figure 1
Figure 1
BRET assay to monitor hIR activation. (A) Schematic representation of the BRET-based assay to monitor insulin-induced hIR activation through the detection of the physical proximity between hIR–Rluc8 and its YFP-tagged signaling proteins. For this, HEK293 cells transiently co-expressing hIR–Rluc8 with either IRS1–YFP (B,D) or Grb2–Venus (C,E) were stimulated (red circle) or not (black square) with 100 nM (B,C) or increasing doses (D,E) of insulin and BRET measurements were performed in real-time and live cells as described in Section “Materials and Methods.” Data are mean ± SEM of three to six independent experiments performed in triplicate.
Figure 2
Figure 2
Effect of camel milk on BRET between hIR–Rluc8 and its signaling proteins. HEK293 cells transiently co-expressing hIR–Rluc8 and either IRS1–YFP (A,C) or Grb2–Venus (B,D–F) were first pre-treated (blue triangle) or not (black square and red circle) 30 min with camel milk before BRET measurements were performed in the absence or presence of stimulation with 100 nM of insulin as indicated. In parallel, luminescence (E) and fluorescence (F) analysis were carried out to quantify the relative expression of hIR–Rluc8 and Grb2–Venus, respectively. In (C,D), insulin-induced BRET signals in cells not pre-treated with camel milk (red circle) were normalized to 100%. Data are mean ± SEM of 3–10 independent experiments performed in triplicate.
Figure 3
Figure 3
Time-course and dose–response analysis of the effect of camel milk on BRET signals. HEK293 cells transiently co-expressing hIR–Rluc8 and either Grb2–Venus (A,C) or IRS1–YFP (B) were first pre-treated (blue triangle) or not (red circle) different times (A) or 30 min (B,C) with camel milk before BRET measurements were performed in the absence or presence of stimulation with 100 nM (A) or increasing doses (B,C) of insulin as indicated. Data are mean ± SEM of three (A,B) or six (C) independent experiments performed in triplicate.
Figure 4
Figure 4
Camel milk fractionations. (A) The defatted camel milk was fractionated and the resulting fractions were submitted to SDS-PAGE followed by staining with the Coomassie Blue as indicated in Section “Materials and Methods.” The different tracks represent caseins (1) and whey (2) as well as the fractions 25 (3), 30 (4 and 5), and 45 (6) obtained from gel filtration chromatography (B). For gel filtration chromatography, fresh camel milk was first defatted and passed through Sephadex G-25 column and different proteins and non-protein fractions were eluted according to their absorbance at 215 nm (red graph) and 280 nm (blue graph) and conductance for non-protein fractions (light blue).
Figure 5
Figure 5
Effect of camel milk fractions on BRET signals. HEK293 cells transiently co-expressing hIR–Rluc8 and Grb2–Venus were first pre-treated or not (control, red circle) 30 min with either whole camel milk (blue triangle) or its different fractions obtained by either centrifugation (A), gel filtration chromatography (B,C), or molecular weight cutoff using appropriate filters (D). Real-time BRET measurements were then performed in the absence or presence of stimulation with 100 nM of insulin as indicated. (C) The comparison of the maximal values of insulin-induced BRET averaged from the plateau of the curves shown in (B). Data are representative of three independent experiments (A,D) or mean ± SEM of three experiments (B,C) all performed in triplicate.
Figure 6
Figure 6
Effect of camel milk on ERK1/2 and Akt phosphorylation. HEK293 cells transiently co-expressing hIR–Rluc8 and Grb2–Venus were used for ERK1/2 and Akt phosphorylation using the HTRF®-based assay (A–D) and SDS-PAGE/western blot technique (E,F). First, time-course analysis of phospho-ERK1/2 (A) and phospho-Akt (B) upon stimulation with 100 nM of insulin at different times was performed and HTRF signals were measured as described in Section “Materials and Methods.” Next, cells were first pre-treated or not 30 min with camel milk and stimulated or not 5 min with 100 nM of insulin before HTRF signals were measured as indicated. For the western blot analysis, cells were first pre-treated or not 30 min with camel milk and stimulated or not 5 min with 100 or 1 μM of insulin before SDS-PAGE and western blot using a rabbit polyclonal antibody against phospho-ERK1/2 (Thr202/Tyr204) (E). The western blot signals were quantified and expressed in arbitrary units after normalization (F). The HTRF data are mean ± SEM of three (for Akt) and four (for ERK1/2) independent experiments performed in triplicate. The western blot data are representative of two experiments.
Figure 7
Figure 7
Schematic model of allosteric action of camel milk on hIR. The positive allosteric action of camel milk implies induction/stabilization of specific conformation of hIR with an impact on its downstream signaling. Indeed, in the presence of camel milk the conformation of hIR (conformation B) (B) is more efficient with regard to insulin-promoted ERK1/2 activation, but probably not Akt, compared to the conformation bound to insulin in the absence of camel milk component (conformation A) (A).

References

    1. Gaughan JB. Which physiological adaptation allows camels to tolerate high heat load – and what more can we learn? J Camelid Sci (2011) 4:85–8.
    1. Duehlmeier R, Sammet K, Widdel A, von Engelhardt W, Wernery U, Kinne J, et al. Distribution patterns of the glucose transporters GLUT4 and GLUT1 in skeletal muscles of rats (Rattus norvegicus), pigs (Sus scrofa), cows (Bos taurus), adult goats, goat kids (Capra hircus), and camels (Camelus dromedarius). Comp Biochem Physiol A Mol Integr Physiol (2007) 146:274–82.10.1016/j.cbpa.2006.10.029 - DOI - PubMed
    1. Wernery U, Johnson B, Ishmail WT. Insulin content in raw dromedary milk and serum measured over one lactation period. J Camel Pract Res (2006) 13:89–90.
    1. Wernery U, Nagy P, Bhai I, Schiele W, Johnson B. The effect of heat treatment, pasteurization and different storage temperatures on insulin concentrations in camel milk. Milchwissenschaft (2006) 61:25–8.
    1. Konuspayeva G, Faye B, Loiseau G. The composition of camel milk: a meta-analysis of the literature data. J Food Compost Anal (2009) 22:95–101.10.1016/j.jfca.2008.09.008 - DOI