

In vitro Biochemical Characterization of All Barley Endosperm Starch Synthases
- PMID: 26858729
- PMCID: PMC4730117
- DOI: 10.3389/fpls.2015.01265
In vitro Biochemical Characterization of All Barley Endosperm Starch Synthases
Abstract
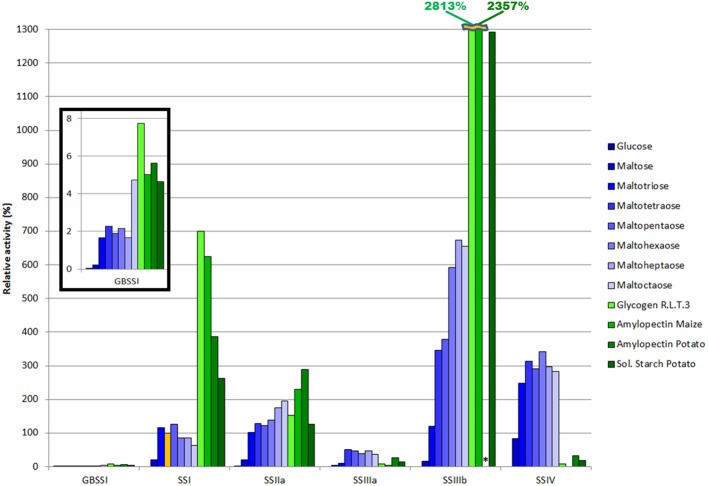
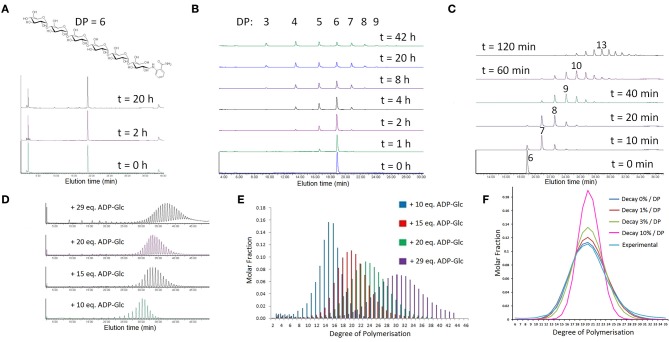
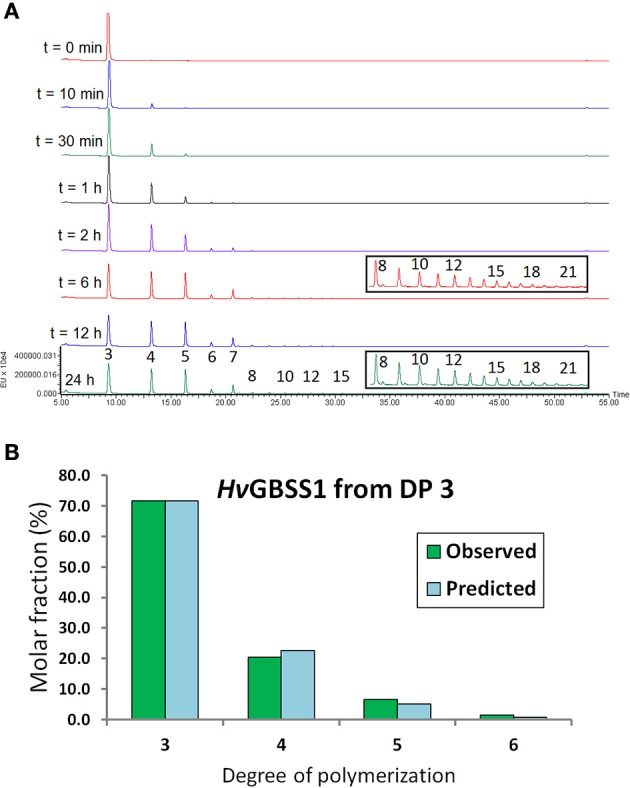
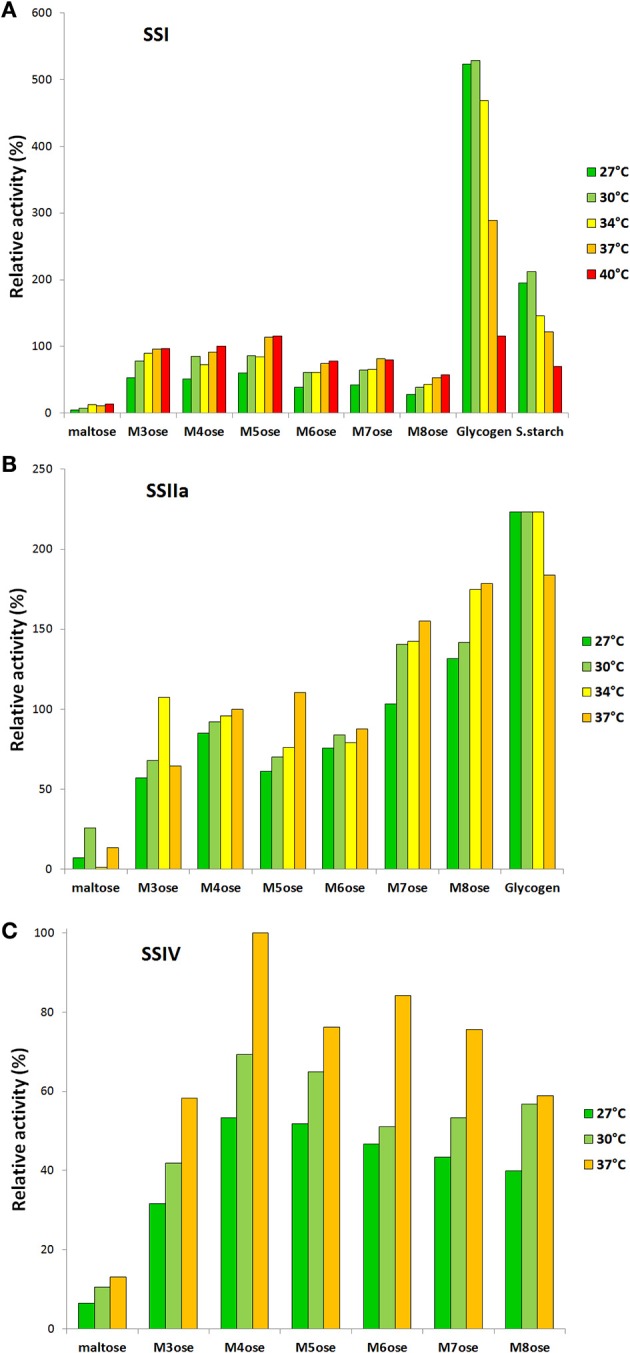
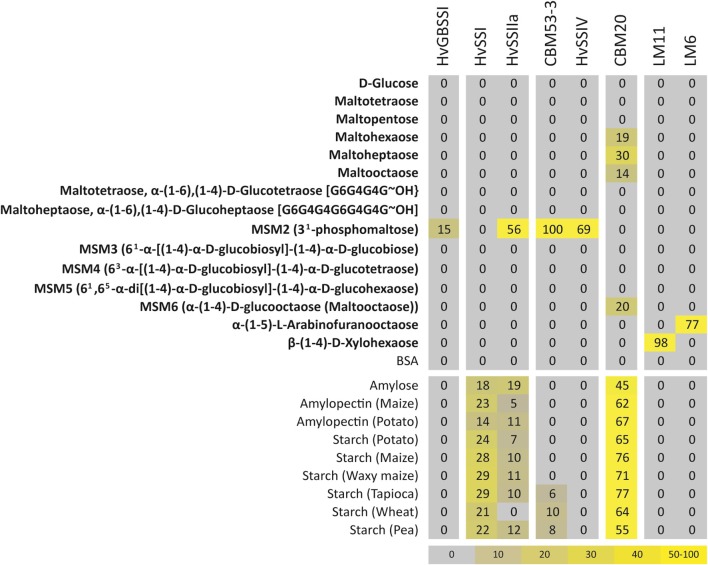
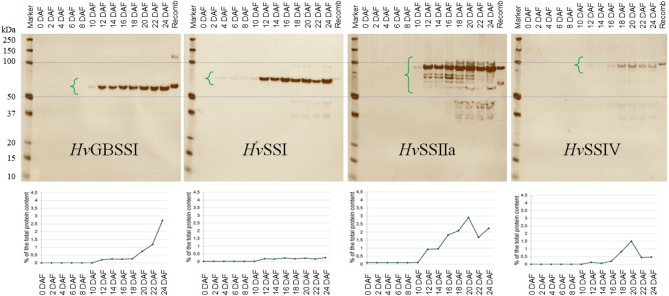
Starch is the main storage polysaccharide in cereals and the major source of calories in the human diet. It is synthesized by a panel of enzymes including five classes of starch synthases (SSs). While the overall starch synthase (SS) reaction is known, the functional differences between the five SS classes are poorly understood. Much of our knowledge comes from analyzing mutant plants with altered SS activities, but the resulting data are often difficult to interpret as a result of pleitropic effects, competition between enzymes, overlaps in enzyme activity and disruption of multi-enzyme complexes. Here we provide a detailed biochemical study of the activity of all five classes of SSs in barley endosperm. Each enzyme was produced recombinantly in E. coli and the properties and modes of action in vitro were studied in isolation from other SSs and other substrate modifying activities. Our results define the mode of action of each SS class in unprecedented detail; we analyze their substrate selection, temperature dependence and stability, substrate affinity and temporal abundance during barley development. Our results are at variance with some generally accepted ideas about starch biosynthesis and might lead to the reinterpretation of results obtained in planta. In particular, they indicate that granule bound SS is capable of processive action even in the absence of a starch matrix, that SSI has no elongation limit, and that SSIV, believed to be critical for the initiation of starch granules, has maltoligosaccharides and not polysaccharides as its preferred substrates.
Keywords: affinity; barley; biochemical characterization; expression levels; kinetics; stability; starch synthases; substrate specificity.
Figures

Similar articles
-
Crystal Structures of the Catalytic Domain of Arabidopsis thaliana Starch Synthase IV, of Granule Bound Starch Synthase From CLg1 and of Granule Bound Starch Synthase I of Cyanophora paradoxa Illustrate Substrate Recognition in Starch Synthases.Front Plant Sci. 2018 Aug 3;9:1138. doi: 10.3389/fpls.2018.01138. eCollection 2018. Front Plant Sci. 2018. PMID: 30123236 Free PMC article.
-
Structure of starch synthase I from barley: insight into regulatory mechanisms of starch synthase activity.Acta Crystallogr D Biol Crystallogr. 2013 Jun;69(Pt 6):1013-25. doi: 10.1107/S090744491300440X. Epub 2013 May 14. Acta Crystallogr D Biol Crystallogr. 2013. PMID: 23695246
-
Relationships between starch synthase I and branching enzyme isozymes determined using double mutant rice lines.BMC Plant Biol. 2014 Mar 26;14:80. doi: 10.1186/1471-2229-14-80. BMC Plant Biol. 2014. PMID: 24670252 Free PMC article.
-
Effects of Various Allelic Combinations of Starch Biosynthetic Genes on the Properties of Endosperm Starch in Rice.Rice (N Y). 2022 Apr 19;15(1):24. doi: 10.1186/s12284-022-00570-8. Rice (N Y). 2022. PMID: 35438319 Free PMC article. Review.
-
Starch biosynthesis in cereal endosperm.Plant Physiol Biochem. 2010 Jun;48(6):383-92. doi: 10.1016/j.plaphy.2010.03.006. Epub 2010 Mar 24. Plant Physiol Biochem. 2010. PMID: 20400324 Review.
Cited by
-
Amylopectin Chain Length Dynamics and Activity Signatures of Key Carbon Metabolic Enzymes Highlight Early Maturation as Culprit for Yield Reduction of Barley Endosperm Starch after Heat Stress.Plant Cell Physiol. 2019 Dec 1;60(12):2692-2706. doi: 10.1093/pcp/pcz155. Plant Cell Physiol. 2019. PMID: 31397873 Free PMC article.
-
A model for the reproduction of amylopectin cluster by coordinated actions of starch branching enzyme isoforms.Plant Mol Biol. 2023 Jul;112(4-5):199-212. doi: 10.1007/s11103-023-01352-6. Epub 2023 Jun 9. Plant Mol Biol. 2023. PMID: 37294528 Review.
-
A Review of Starch Biosynthesis in Relation to the Building Block-Backbone Model.Int J Mol Sci. 2020 Sep 23;21(19):7011. doi: 10.3390/ijms21197011. Int J Mol Sci. 2020. PMID: 32977627 Free PMC article. Review.
-
Starch formation inside plastids of higher plants.Protoplasma. 2018 Nov;255(6):1855-1876. doi: 10.1007/s00709-018-1259-4. Epub 2018 May 17. Protoplasma. 2018. PMID: 29774409 Review.
-
Theoretical and experimental approaches to understand the biosynthesis of starch granules in a physiological context.Photosynth Res. 2020 Jul;145(1):55-70. doi: 10.1007/s11120-019-00704-y. Epub 2020 Jan 18. Photosynth Res. 2020. PMID: 31955343 Free PMC article.
References
-
- Blennow A., Engelsen S. B., Munck L., Møller B. L. (2000). Starch molecular structure and phosphorylation investigated by a combined chromatographic and chemometric approach. Carbohydr. Polym. 41, 163–174. 10.1016/S0144-8617(99)00082-X - DOI
-
- Blennow A., Jensen S. L., Shaik S. S., Skryhan K., Carciofi M., Holm P. B., et al. (2013). Future cereal starch bioengineering: cereal ancestors encounter gene technology and designer enzymes. Cereal. Chem. 90, 274–287. 10.1094/CCHEM-01-13-0010-FI - DOI
-
- Brust H., Orzechowski S., Fettke J., Steup M. (2013). Special issue?: starch metabolism, structure and properties review starch synthesizing reactions and paths?: in vitro and in vivo studies. J. Appl. Glycosci. 60, 3–20. 10.5458/jag.jag.JAG-2012_018 - DOI
LinkOut - more resources
Full Text Sources
Other Literature Sources