. 2016 Jan 26:7:12.
doi: 10.3389/fpls.2016.00012. eCollection 2016.

Class-Specific Evolution and Transcriptional Differentiation of 14-3-3 Family Members in Mesohexaploid Brassica rapa

Affiliations

Class-Specific Evolution and Transcriptional Differentiation of 14-3-3 Family Members in Mesohexaploid Brassica rapa

Ruby Chandna et al. Front Plant Sci. .

Abstract

14-3-3s are highly conserved, multigene family proteins that have been implicated in modulating various biological processes. The presence of inherent polyploidy and genome complexity has limited the identification and characterization of 14-3-3 proteins from globally important Brassica crops. Through data mining of Brassica rapa, the model Brassica genome, we identified 21 members encoding 14-3-3 proteins namely, BraA.GRF14.a to BraA.GRF14.u. Phylogenetic analysis indicated that B. rapa contains both ε (epsilon) and non-ε 14-3-3 isoforms, having distinct intron-exon structural organization patterns. The non-ε isoforms showed lower divergence rate (Ks < 0.45) compared to ε protein isoforms (Ks > 0.48), suggesting class-specific divergence pattern. Synteny analysis revealed that mesohexaploid B. rapa genome has retained 1-5 orthologs of each Arabidopsis 14-3-3 gene, interspersed across its three fragmented sub-genomes. qRT-PCR analysis showed that 14 of the 21 BraA.GRF14 were expressed, wherein a higher abundance of non-ε transcripts was observed compared to the ε genes, indicating class-specific transcriptional bias. The BraA.GRF14 genes showed distinct expression pattern during plant developmental stages and in response to abiotic stress, phytohormone treatments, and nutrient deprivation conditions. Together, the distinct expression pattern and differential regulation of BraA.GRF14 genes indicated the occurrence of functional divergence of B. rapa 14-3-3 proteins during plant development and stress responses.

Keywords: 14-3-3; Brassica rapa; expression differentiation; gene divergence; polyploidy.


Figures
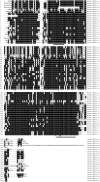
Figure 1
Figure 1
Amino acid alignment of the deduced 14-3-3 proteins of B. rapa (BraA.GRF14). The sequence alignment of the 21 BraA.GRF14 proteins was performed using ClustalW. The 14-3-3 signature motifs RNL(L/V)SV(G/A)YKNV and YKDSTLIMQLLRDNLTLWTS, are underlined. The phosphorylation sites reported earlier for plant 14-3-3 proteins (Paul et al., 2012) are marked with asterisk.
Figure 2
Figure 2
Phylogenetic analysis and gene structures of the deduced 14-3-3 proteins of B. rapa (BraA.GRF14). The evolutionary history was inferred by using the Maximum Likelihood method based on the JTT matrix-based model conducted in MEGA5 (Tamura et al., 2011). The percentage of replicate trees in which the associated taxa clustered together in the bootstrap test (1000 replicates) is shown next to the branches. The tree is drawn to scale, with branch lengths measured in the number of substitutions per site. The sizes (in bp) and organization of exons (dark boxes) and introns (lines) of BraA.GRF14 genes are marked along with.
Figure 3
Figure 3
Expression profile of B. rapa 14-3-3 genes (BraA.GRF14) across plant developmental stages. A heat map representing hierarchical clustering of average fold values of BraA.GRF14 genes expression (w.r.t. GAPDH, set at 100) in various developmental tissues (mentioned at the top of each lane) is shown. The color scale representing average signal is shown at the bottom of the heat map.
Figure 4
Figure 4
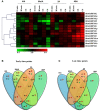
Expression profile of BraA.GRF14 genes in 6 days old B. rapa seedlings in response to abiotic stress conditions. (A) A heat map representing hierarchical clustering of average fold change of BraA.GRF14 genes expression in response to dehydration, cold (4°C), heat (37°C), and salt (300 mM NaCl) treatments at different time points (15 min, 30 min, 3 h, and 6 h) is shown (mentioned at the top of each lane). The mock treated seedlings of same time interval served as control (set at 1) and expression was normalized with ACT2 gene. The color scale representing average signal is shown at the bottom of the heat map. The Venn diagrams represent the total number of BraA.GRF14 genes which were upregulated (red upward arrow) and down-regulated (green downward arrow) during (B) early (15 and 30 min), and (C) late (3 and 6 h) abiotic stress conditions.
Figure 5
Figure 5
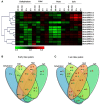
Expression profile of BraA.GRF14 genes in 6 days old B. rapa seedlings in response to phytohormone treatments. (A) A heat map representing hierarchical clustering of average fold change of BraA.GRF14 genes expression in response to methyl jasmonate (MeJA, 0.2 mM), salicylic acid (SA, 0.2 mM), 1-aminocyclopropane carboxylate (ACC, 0.1 mM), indole-3-acetic acid (IAA, 0.1 mM), and abscisic acid (ABA, 0.1 mM) at different time points (15, 30 min, 3 and 6 h) is shown (mentioned at the top of each lane). The mock treated seedlings of same time interval served as control (set at 1) and expression was normalized with ACT2 gene. The color scale representing average signal is shown at the bottom of the heat map. The Venn diagrams represent the total number of BraA.GRF14 genes which were upregulated (red upward arrow) and down-regulated (green downward arrow) during (B) early (15 and 30 min), and (C) late (3 and 6 h) phytohormone treatments.
Figure 6
Figure 6
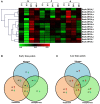
Expression profile of BraA.GRF14 genes during nutrient deprivation conditions in 5 days old B. rapa seedlings. (A) A heat map representing hierarchical clustering of average fold change of BraA.GRF14 gene expression in response to nutrient deprived conditions at different time points (mentioned at the top of each lane). The 5 days old B. rapa seedlings were harvested at different time points (1, 6, 24, and 48 h) after they were exposed to nutrient solution lacking Nitrogen (N), Phosphorus (P), and Potassium (K). The mock treated seedlings of same time interval served as control (set at 1) and expression was normalized with ACT2 gene. The color scale representing average signal is shown at the bottom of the heat map. The Venn diagrams represent the total number of BraA.GRF14 genes which were upregulated (red upward arrow) and down-regulated (green downward arrow) during (B) early (1 and 6 h), and (C) late (24 and 48 h) nutrient deprived conditions.

Similar articles

Cited by

References

    1. Adams K. L. (2007). Evolution of duplicate gene expression in polyploid and hybrid plants. J. Hered. 98, 136–141. 10.1093/jhered/esl061 - DOI - PubMed
    1. Agrawal G. K., Thelen J. J. (2006). Large scale identification and quantitative profiling of phosphoproteins expressed during seed filling in oilseed rape. Mol. Cell Proteomics 5, 2044–2059. 10.1074/mcp.m600084-mcp200 - DOI - PubMed
    1. Arya G. C., Kumar R., Bisht N. C. (2014). Evolution, expression differentiation and interaction specificity of heterotrimeric G-protein subunit gene family in the mesohexaploid Brassica rapa. PLoS ONE 9:e105771. 10.1371/journal.pone.0105771 - DOI - PMC - PubMed
    1. Augustine R., Majee M., Gershenzon J., Bisht N. C. (2013). Four genes encoding MYB28, a major transcriptional regulator of the aliphatic glucosinolate pathway, are differentially expressed in the allopolyploid Brassica juncea. J. Exp. Bot. 64, 4907–4921. 10.1093/jxb/ert280 - DOI - PMC - PubMed
    1. Bachmann M., Huber J. L., Athwal G. S., Wu K., Ferl R. J., Huber S. C. (1996). 14-3-3 proteins associate with the regulatory phosphorylation site of spinach leaf nitrate reductase in an isoform-specific manner and reduce dephosphorylation of Ser-543 by endogenous protein phosphatases. FEBS Lett. 398, 26–30. 10.1016/s0014-5793(96)01188-x - DOI - PubMed

LinkOut - more resources