. 2016 Jan 28:7:17.
doi: 10.3389/fpls.2016.00017. eCollection 2016.

Genome-Wide Identification of QTL for Seed Yield and Yield-Related Traits and Construction of a High-Density Consensus Map for QTL Comparison in Brassica napus

Affiliations

Genome-Wide Identification of QTL for Seed Yield and Yield-Related Traits and Construction of a High-Density Consensus Map for QTL Comparison in Brassica napus

Weiguo Zhao et al. Front Plant Sci. .

Abstract

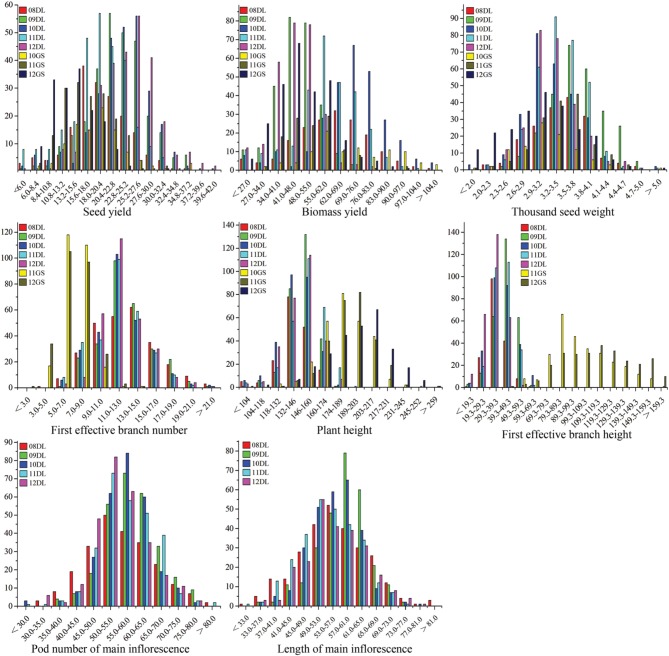
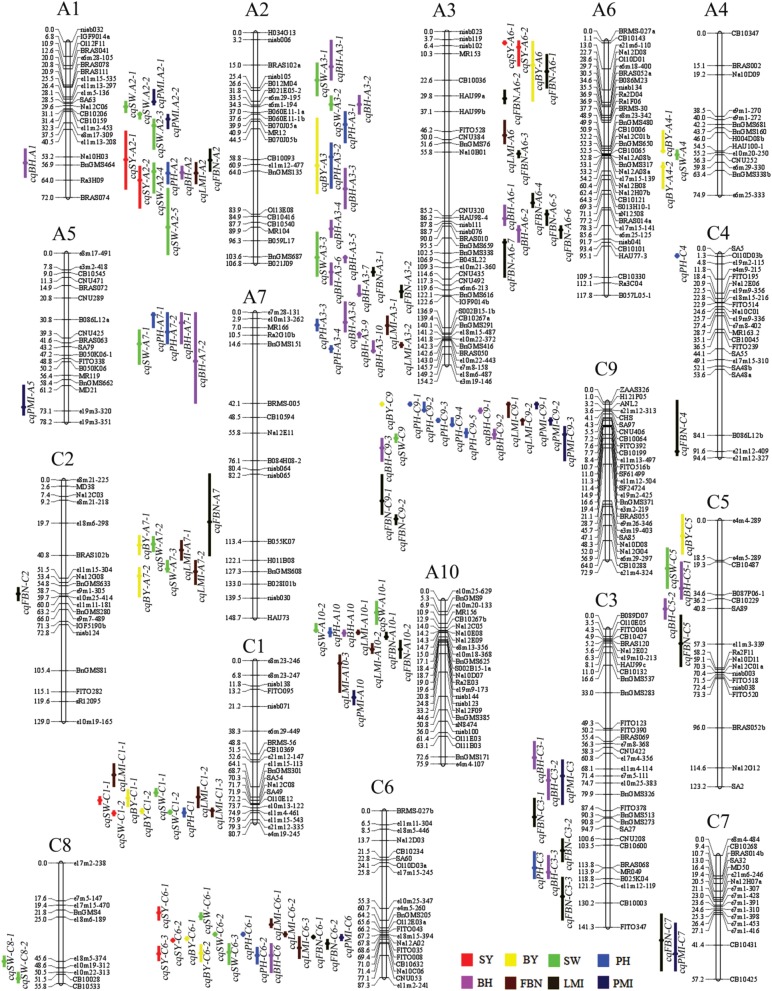
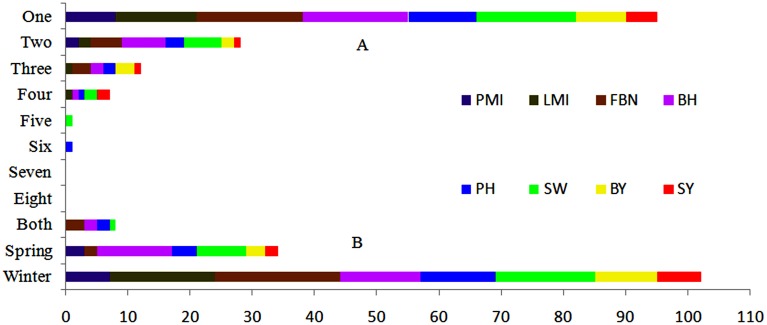
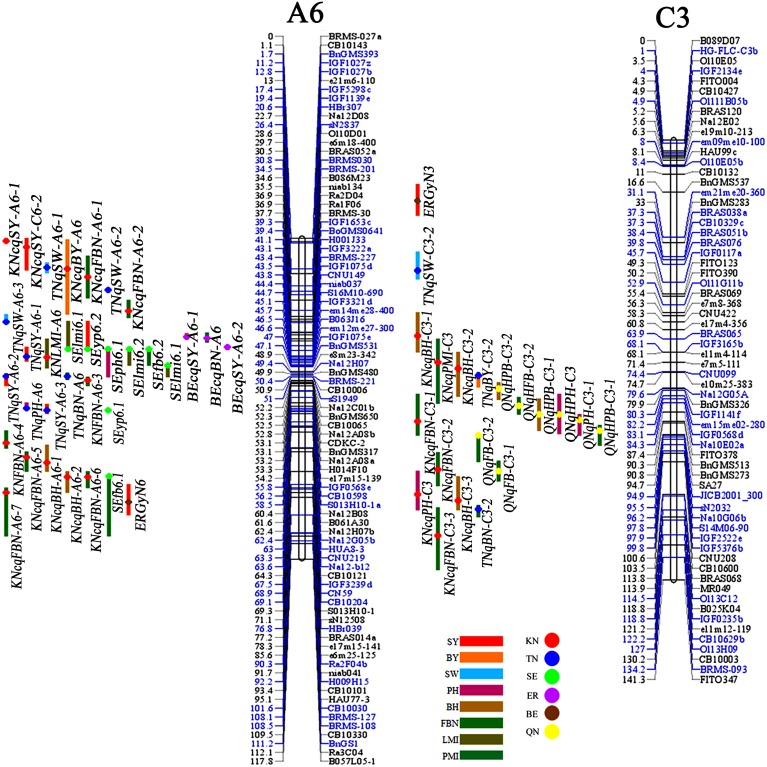
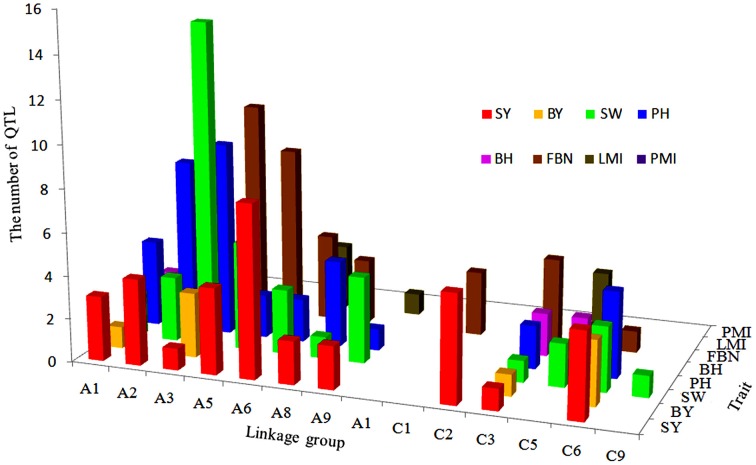
Seed yield (SY) is the most important trait in rapeseed, is determined by multiple seed yield-related traits (SYRTs) and is also easily subject to environmental influence. Many quantitative trait loci (QTLs) for SY and SYRTs have been reported in Brassica napus; however, no studies have focused on seven agronomic traits simultaneously affecting SY. Genome-wide QTL analysis for SY and seven SYRTs in eight environments was conducted in a doubled haploid population containing 348 lines. Totally, 18 and 208 QTLs for SY and SYRTs were observed, respectively, and then these QTLs were integrated into 144 consensus QTLs using a meta-analysis. Three major QTLs for SY were observed, including cqSY-C6-2 and cqSY-C6-3 that were expressed stably in winter cultivation area for 3 years and cqSY-A2-2 only expressed in spring rapeseed area. Trait-by-trait meta-analysis revealed that the 144 consensus QTLs were integrated into 72 pleiotropic unique QTLs. Among them, all the unique QTLs affected SY, except for uq.A6-1, including uq.A2-3, uq.C1-2, uq.C1-3, uq.C6-1, uq.C6-5, and uq.C6-6 could also affect more than two SYRTs. According to the constructed high-density consensus map and QTL comparison from literatures, 36 QTLs from five populations were co-localized with QTLs identified in this study. In addition, 13 orthologous genes were observed, including five each gene for SY and thousand seed weight, and one gene each for biomass yield, branch height, and plant height. The genomic information of these QTLs will be valuable in hybrid cultivar breeding and in analyzing QTL expression in different environments.

Keywords: Brassica napus; candidate genes; map comparsion; quantitative trait loci; seed yield; seed yield-related traits.


Figures

Figure 1
Figure 1
The frequency distribution of SY and SYRTs in multiple environments. The units of the x-axis are the phenotypic values, and the units of the y-axis are the number of lines. SY and SYRTs in different experiments was discriminated using different colored boxes. A unit of measurement: seed yield (g), biomass yield (g), thousand seed weight (g), plant height (cm), first effective branch height (cm), first effective branch number, length of main inflorescence (cm), pod number of main inflorescence.
Figure 2
Figure 2
Genetic linkage map and the location of QTLs for SY and SYRTs in the KN linkage map. The 144 consensus QTLs for SY and SYRTs were distributed on 18 linkage groups with the exception of A8, A1–A10 were represented by the A genome and C1–C9 were represented by the C genome in B. napus. The loci names were listed on the right of the linkage groups, while position of loci were showed on the left side of linkage groups. The consensus QTLs associated with SY and SYRTs were indicated by bars with various backgrounds on the left of each linkage group (Red bar, seed yield; Yellow bar, biomass yield; Green bar, thousand seed weight; Blue bar, plant height; Purple bar, first effective branch height; Brown bar, first effective branch number; Black bar, length of main inflorescence; Dark blue bar, pod number of main inflorescence).
Figure 3
Figure 3
Expression response of 144 consensus QTLs in nature environments. (A) Number of consensus QTLs appeared in one to eight micro-environments. (B) Number of consensus QTLs appeared in winter, spring or both macro-environments.
Figure 4
Figure 4
The consensus map and QTLs for SY and SYRTs in different populations (A6 and C3). Markers with blue color indicated these makers were projected from other maps on the KN map based on common markers by BioMercator 2.1 software. QTLs for SY and SYRTs detected in different populations were discriminated with different color bars on the left of each linkage group. Red bar, SY (seed yield); Orange bar, BY (biomass yield); Cambridge blue bar, SW (thousand seed weight); Purple bar, PH (plant height); Claybank bar, BH (first effective branch height); Green bar, FBN (first effective branch number); Breen bar, LMI (length of main inflorescence); Blue-green bar, PMI (pod number of main inflorescence). The KN population and five populations were indicated by disks with various backgrounds on the bars of each QTL. Red disk, KN population; Blue disk, TN population; Light green disk, SE population; Light purple disk, ER population; Brown disk, BE population; Yellow disk, QN population.
Figure 5
Figure 5
The number and distribution of projection QTLs for SY and SYRTs from five population in B. napus. The x-axis of abscissas indicated 19 linkage groups, y-axis indicated the number of projection QTLs and z-axis indicated SY and SYRTs.

References

    1. Arcade A., Labourdette A., Falque M., Mangin B., Chardon F., Charcosset A., et al. . (2004). BioMercator: integrating genetic maps and QTL towards discovery of candidate genes. Bioinformatics 20, 2324–2326. 10.1093/bioinformatics/bth230 - DOI - PubMed
    1. Ashikari M., Sakakibara H., Lin S., Yamamoto T., Takashi T., Nishimura A., et al. . (2005). Cytokinin oxidase regulates rice grain production. Science 309, 741–745. 10.1126/science.1113373 - DOI - PubMed
    1. Basunanda P., Radoev M., Ecke W., Friedt W., Becker H. C., Snowdon R. J. (2010). Comparative mapping of quantitative trait loci involved in heterosis for seedling and yield traits in oilseed rape (Brassica napus L.). Theor. Appl. Genet. 120, 271–281. 10.1007/s00122-009-1133-z - DOI - PMC - PubMed
    1. Boivin K., Acarkan A., Mbulu R. S., Clarenz O., Schmidt R. (2004). The Arabidopsis genome sequence as a tool for genome analysis in Brassicaceae. A comparison of the Arabidopsis and capsella rubella genomes. Plant Physiol. 135, 735–744. 10.1104/pp.104.040030 - DOI - PMC - PubMed
    1. Burgess-Herbert S., Cox A., Tsaih S. W., Paigen B. (2008). Practical applications of the bioinformatics tool box for narrowing quantitative trait loci. Genetics 180, 2227–2235. 10.1534/genetics.108.090175 - DOI - PMC - PubMed

LinkOut - more resources