

Enhancement of microfluidic particle separation using cross-flow filters with hydrodynamic focusing
- PMID: 26858812
- PMCID: PMC4723399
- DOI: 10.1063/1.4939944
Enhancement of microfluidic particle separation using cross-flow filters with hydrodynamic focusing
Abstract
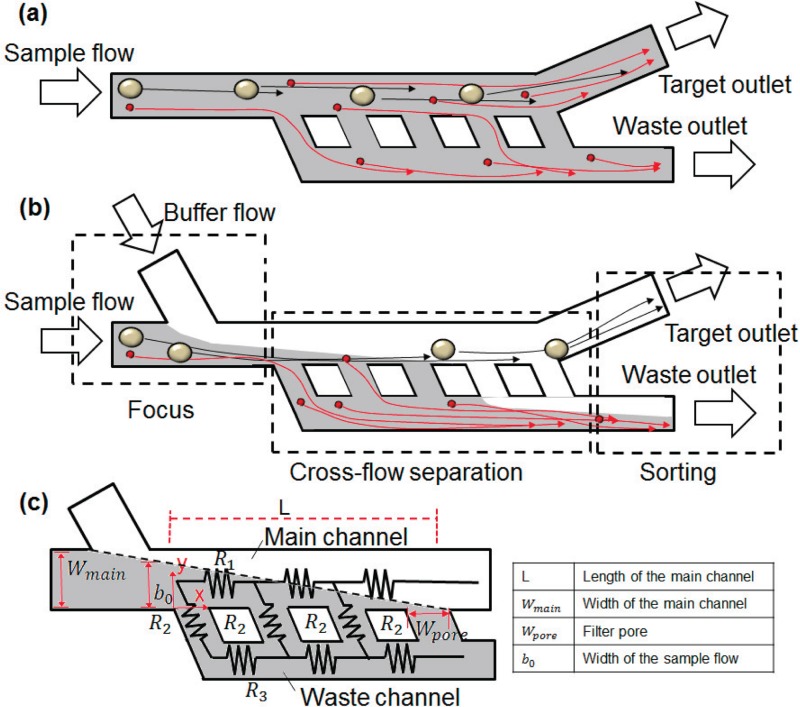
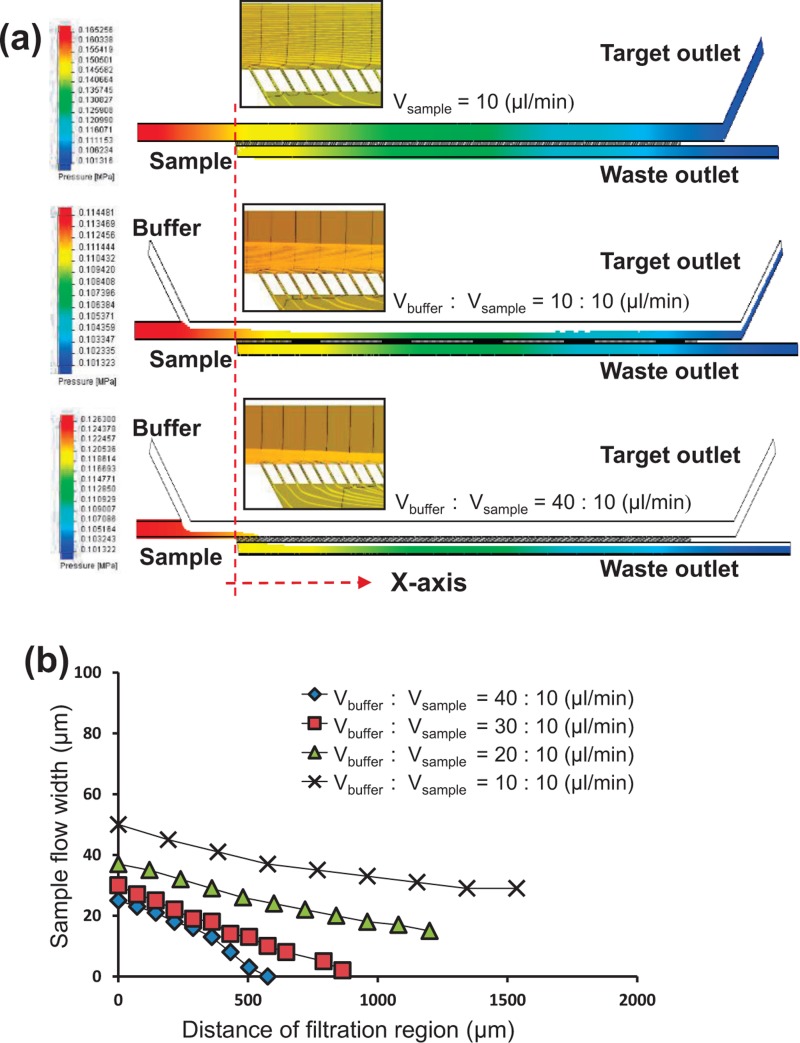
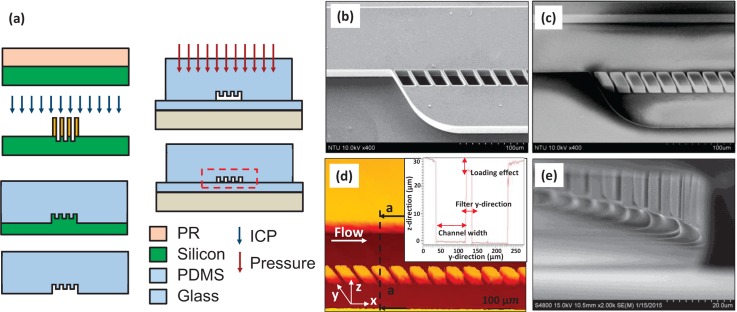
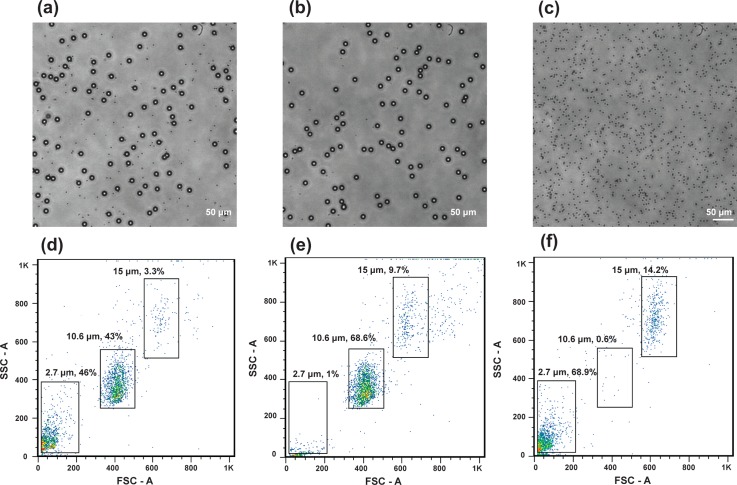
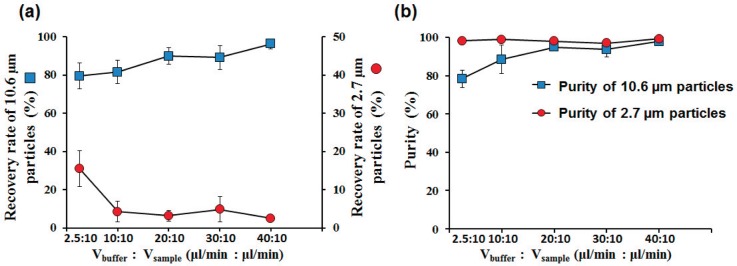
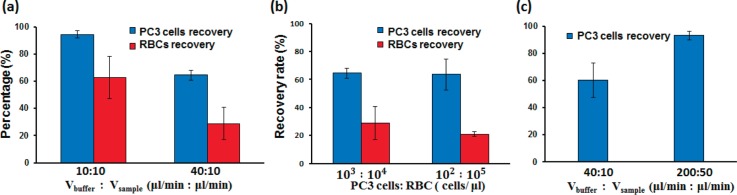
A microfluidic chip is proposed to separate microparticles using cross-flow filtration enhanced with hydrodynamic focusing. By exploiting a buffer flow from the side, the microparticles in the sample flow are pushed on one side of the microchannels, lining up to pass through the filters. Meanwhile a larger pressure gradient in the filters is obtained to enhance separation efficiency. Compared with the traditional cross-flow filtration, our proposed mechanism has the buffer flow to create a moving virtual boundary for the sample flow to actively push all the particles to reach the filters for separation. It further allows higher flow rates. The device only requires soft lithograph fabrication to create microchannels and a novel pressurized bonding technique to make high-aspect-ratio filtration structures. A mixture of polystyrene microparticles with 2.7 μm and 10.6 μm diameters are successfully separated. 96.2 ± 2.8% of the large particle are recovered with a purity of 97.9 ± 0.5%, while 97.5 ± 0.4% of the small particle are depleted with a purity of 99.2 ± 0.4% at a sample throughput of 10 μl/min. The experiment is also conducted to show the feasibility of this mechanism to separate biological cells with the sample solutions of spiked PC3 cells in whole blood. By virtue of its high separation efficiency, our device offers a label-free separation technique and potential integration with other components, thereby serving as a promising tool for continuous cell filtration and analysis applications.
Figures

Similar articles
-
Tapered Microfluidic for Continuous Micro-Object Separation Based on Hydrodynamic Principle.IEEE Trans Biomed Circuits Syst. 2017 Dec;11(6):1413-1421. doi: 10.1109/TBCAS.2017.2764118. IEEE Trans Biomed Circuits Syst. 2017. PMID: 29293427
-
A hydrodynamic-based dual-function microfluidic chip for high throughput discriminating tumor cells.Talanta. 2024 Jun 1;273:125884. doi: 10.1016/j.talanta.2024.125884. Epub 2024 Mar 13. Talanta. 2024. PMID: 38508128
-
Parallelization of Curved Inertial Microfluidic Channels to Increase the Throughput of Simultaneous Microparticle Separation and Washing.Micromachines (Basel). 2024 Sep 30;15(10):1228. doi: 10.3390/mi15101228. Micromachines (Basel). 2024. PMID: 39459102 Free PMC article.
-
Inertial Focusing of Microparticles in Curvilinear Microchannels.Sci Rep. 2016 Dec 19;6:38809. doi: 10.1038/srep38809. Sci Rep. 2016. PMID: 27991494 Free PMC article.
-
Label-free microfluidic sorting of microparticles.APL Bioeng. 2019 Dec 11;3(4):041504. doi: 10.1063/1.5120501. eCollection 2019 Dec. APL Bioeng. 2019. PMID: 31832577 Free PMC article. Review.
Cited by
-
Microfluidics for Peptidomics, Proteomics, and Cell Analysis.Nanomaterials (Basel). 2021 Apr 26;11(5):1118. doi: 10.3390/nano11051118. Nanomaterials (Basel). 2021. PMID: 33925983 Free PMC article. Review.
-
Flow induced particle separation and collection through linear array pillar microfluidics device.Biomicrofluidics. 2020 Mar 19;14(2):024103. doi: 10.1063/1.5143656. eCollection 2020 Mar. Biomicrofluidics. 2020. PMID: 32206158 Free PMC article.
-
Public-Health-Driven Microfluidic Technologies: From Separation to Detection.Micromachines (Basel). 2021 Apr 2;12(4):391. doi: 10.3390/mi12040391. Micromachines (Basel). 2021. PMID: 33918189 Free PMC article. Review.
-
Liposomes or Extracellular Vesicles: A Comprehensive Comparison of Both Lipid Bilayer Vesicles for Pulmonary Drug Delivery.Polymers (Basel). 2023 Jan 7;15(2):318. doi: 10.3390/polym15020318. Polymers (Basel). 2023. PMID: 36679199 Free PMC article. Review.
-
Cyclic tangential flow filtration system for isolation of extracellular vesicles.APL Bioeng. 2021 Feb 10;5(1):016103. doi: 10.1063/5.0037768. eCollection 2021 Mar. APL Bioeng. 2021. PMID: 33688618 Free PMC article.
References
-
- Sajeesh P. and Sen A. K., “ Particle separation and sorting in microfluidic devices: A review,” Microfluid. Nanofluid. 17(1), 1–52 (2013).10.1007/s10404-013-1291-9 - DOI
-
- Tripathi S. et al., “ Passive blood plasma separation at the microscale: A review of design principles and microdevices,” J. Micromech. Microeng. 25(8), 083001 (2015).10.1088/0960-1317/25/8/083001 - DOI
-
- Azim W. et al., “ Diagnostic significance of serum protein electrophoresis,” Biomedica 20(1), 40–44 (2004).
LinkOut - more resources
Full Text Sources
Other Literature Sources