Enhanced brain signal variability in children with autism spectrum disorder during early childhood
- PMID: 26859309
- PMCID: PMC5064657
- DOI: 10.1002/hbm.23089
Enhanced brain signal variability in children with autism spectrum disorder during early childhood
Abstract
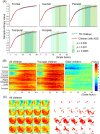
Extensive evidence shows that a core neurobiological mechanism of autism spectrum disorder (ASD) involves aberrant neural connectivity. Recent advances in the investigation of brain signal variability have yielded important information about neural network mechanisms. That information has been applied fruitfully to the assessment of aging and mental disorders. Multiscale entropy (MSE) analysis can characterize the complexity inherent in brain signal dynamics over multiple temporal scales in the dynamics of neural networks. For this investigation, we sought to characterize the magnetoencephalography (MEG) signal variability during free watching of videos without sound using MSE in 43 children with ASD and 72 typically developing controls (TD), emphasizing early childhood to older childhood: a critical period of neural network maturation. Results revealed an age-related increase of brain signal variability in a specific timescale in TD children, whereas atypical age-related alteration was observed in the ASD group. Additionally, enhanced brain signal variability was observed in children with ASD, and was confirmed particularly for younger children. In the ASD group, symptom severity was associated region-specifically and timescale-specifically with reduced brain signal variability. These results agree well with a recently reported theory of increased brain signal variability during development and aberrant neural connectivity in ASD, especially during early childhood. Results of this study suggest that MSE analytic method might serve as a useful approach for characterizing neurophysiological mechanisms of typical-developing and its alterations in ASD through the detection of MEG signal variability at multiple timescales.
Keywords: autism spectrum disorder; early childhood; magnetoencephalography; multiscale entropy; signal variability; typical-development.
© 2015 The Authors Human Brain Mapping Published by Wiley Periodicals, Inc.
Figures


Similar articles
-
Band-specific atypical functional connectivity pattern in childhood autism spectrum disorder.Clin Neurophysiol. 2017 Aug;128(8):1457-1465. doi: 10.1016/j.clinph.2017.05.010. Epub 2017 May 23. Clin Neurophysiol. 2017. PMID: 28622528
-
Detection of atypical network development patterns in children with autism spectrum disorder using magnetoencephalography.PLoS One. 2017 Sep 8;12(9):e0184422. doi: 10.1371/journal.pone.0184422. eCollection 2017. PLoS One. 2017. PMID: 28886147 Free PMC article.
-
Patterns of altered neural synchrony in the default mode network in autism spectrum disorder revealed with magnetoencephalography (MEG): Relationship to clinical symptomatology.Autism Res. 2018 Mar;11(3):434-449. doi: 10.1002/aur.1908. Epub 2017 Dec 18. Autism Res. 2018. PMID: 29251830
-
Magnetoencephalography in the study of children with autism spectrum disorder.Psychiatry Clin Neurosci. 2016 Feb;70(2):74-88. doi: 10.1111/pcn.12338. Epub 2015 Sep 18. Psychiatry Clin Neurosci. 2016. PMID: 26256564 Review.
-
Complexity of spontaneous brain activity in mental disorders.Prog Neuropsychopharmacol Biol Psychiatry. 2013 Aug 1;45:258-66. doi: 10.1016/j.pnpbp.2012.05.001. Epub 2012 May 8. Prog Neuropsychopharmacol Biol Psychiatry. 2013. PMID: 22579532 Review.
Cited by
-
Neural Decoding of Multi-Modal Imagery Behavior Focusing on Temporal Complexity.Front Psychiatry. 2020 Jul 30;11:746. doi: 10.3389/fpsyt.2020.00746. eCollection 2020. Front Psychiatry. 2020. PMID: 32848924 Free PMC article.
-
Deterministic characteristics of spontaneous activity detected by multi-fractal analysis in a spiking neural network with long-tailed distributions of synaptic weights.Cogn Neurodyn. 2020 Dec;14(6):829-836. doi: 10.1007/s11571-020-09605-6. Epub 2020 Jun 24. Cogn Neurodyn. 2020. PMID: 33101534 Free PMC article.
-
Developmental Trajectory of Infant Brain Signal Variability: A Longitudinal Pilot Study.Front Neurosci. 2018 Aug 14;12:566. doi: 10.3389/fnins.2018.00566. eCollection 2018. Front Neurosci. 2018. PMID: 30154695 Free PMC article.
-
Specific EEG resting state biomarkers in FXS and ASD.J Neurodev Disord. 2024 Sep 9;16(1):53. doi: 10.1186/s11689-024-09570-9. J Neurodev Disord. 2024. PMID: 39251926 Free PMC article.
-
Multiscale entropy of ADHD children during resting state condition.Cogn Neurodyn. 2023 Aug;17(4):869-891. doi: 10.1007/s11571-022-09869-0. Epub 2022 Aug 30. Cogn Neurodyn. 2023. PMID: 37522046 Free PMC article.
References
-
- Anokhin AP, Birbaumer N, Lutzenberger W, Nikolaev A, Vogel F (1996): Age increases brain complexity. Electroencephalogr Clin Neurophysiol 99:63–68. - PubMed
-
- Anokhin AP, Lutzenberger W, Nikolaev A, Birbaumer N (2000): Complexity of electrocortical dynamics in children: Developmental aspects. Dev Psychobiol 36:9–22. - PubMed
-
- APA (2013): Diagnostic and Statistical Manual of Mental Disorders. Arlington, VA: American Psychiatric Association.
-
- Barabasi AL (2009): Scale‐free networks: A decade and beyond. Science 325:412–413. - PubMed
Publication types
MeSH terms
LinkOut - more resources
Full Text Sources
Other Literature Sources
Medical

