. 2016 Feb 8;36(3):344-52.
doi: 10.1016/j.devcel.2016.01.003.

Cell Size Determines the Strength of the Spindle Assembly Checkpoint during Embryonic Development

Affiliations

Cell Size Determines the Strength of the Spindle Assembly Checkpoint during Embryonic Development

Matilde Galli et al. Dev Cell. .

Abstract

The spindle assembly checkpoint (SAC) delays mitotic progression when chromosomes are not properly attached to microtubules of the mitotic spindle. Cells vary widely in the extent to which they delay mitotic progression upon SAC activation. To explore the mechanisms that determine checkpoint strength in different cells, we systematically measured the mitotic delay induced by microtubule disruption at different stages of embryogenesis in Caenorhabditis elegans. Strikingly, we observed a gradual increase in SAC strength after each round of division. Analysis of mutants that alter cell size or ploidy revealed that SAC strength is determined primarily by cell size and the number of kinetochores. These findings provide clear evidence in vivo that the kinetochore-to-cytoplasm ratio determines the strength of the SAC, providing new insights into why cells exhibit such large variations in their SAC responses.


Figures

Figure 1
Figure 1. The SAC response becomes stronger after each embryonic division in C. elegans
(A–B) Still images from time-lapse video of control (A) or nocodazole-treated (B) embryonic cells expressing GFP-Tubulin (green) and mCherry-H2B (magenta) as they enter and exit mitosis. Asterisks mark the redistribution of GFP-Tubulin at NEB, and arrows point to the exclusion of GFP-tubulin at NER. For late cell stages (right panels), arrowheads in the merged images mark the cell that is being followed from NEB to NER. Time is in min:s, where 0:00 is the frame when NEB is first visible. Scale bars represent 5 μm. (C) Quantification of mitotic timings from control (grey dots) and nocodazole-treated embryos (green dots). Individual measurements are shown with mean (middle bar) and standard deviation (error bars). (D) Quantification of mitotic timings from control (wild type) and Mad3san-1 deletion mutants (san-1(mat5)). Only cells from 16- (light green) or 32-cell stage embryos (dark green) were quantified. Individual measurements are shown with mean (middle bar) and standard deviation (error bars). (E) Quantification of times spent in interphase (from NER to NEB of next division) of DMSO-treated controls and nocodazole-treated embryos. Only Ab cells and their descendants were quantified. Individual measurements are shown with mean (middle bar) and standard deviation (error bars). (F) Quantification of mitotic timings of cells from 2- and 4-cell stage embryos that were followed after nocodazole treatment and mitotic exit. Arrest times are shown for the first and second mitotic arrest, individual cells are connected by lines. Cells that did not re-enter a second mitosis are depicted as black dots.
Figure 2
Figure 2. The SAC response correlates with cell volume
(A) Still image of an embryo expressing GFP-tubulin, mCherry-H2B and GFP-PH (left) and schematic illustration of volume calculations (right; see Experimental Procedures). (B–C) Quantification of SAC arrest times in nocodazole-treated embryos as a function of cell volume. Each dot represents time from NEB to NER in a single cell, and its corresponding volume range (B) or exact volume measurement (C). In (B), individual measurements are shown with mean (middle bar) and standard deviation (error bars) (**p < 0.01, Student’s t-test). (D) Schematic of 2-, 4- and 8-cell stage embryos with cell names. Ab cell and Ab cell descendants are colored green, P cells are colored pink. (E) Individual arrest times are shown for Ab cells, Ab descendants (green) and P cells (pink) at the 2-, 4- and 8-cell stage. Individual measurements are shown with mean (middle bar) and standard deviation (error bars). (NS, not significant, p > 0.05, Student’s t-test). (F) Cell volumes are shown for Ab cells, Ab descendants (green) and P cells (pink) at the 2-, 4- and 8-cell stage. Individual measurements are shown with mean (middle bar) and standard deviation (error bars) (**p < 0.01, Student’s t-test).
Figure 3
Figure 3. SAC strength is determined by cell size and amount of kinetochores
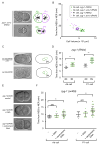
(A) Two examples of differently sized ani-2; zyg-1 (RNAi) embryos at the 2-cell stage (left) and schematic of monopolar division (right). Scale bars represent 10 μm. (B) Quantification of arrest times of 2-cell stage zyg-1 (RNAi) and ani-2; zyg-1 (RNAi) embryos undergoing monopolar divisions. Each dot/triangle represents a single cell; dots are Ab cells and triangles are P1 cells. (C) Still images (left) and schematics (right) of a control diploid embryo from a heterozygote rec-8(ok978)/nT1 parent (top) and a triploid embryo from a homozygote rec-8(ok978) parent (bottom). In rec-8(ok978) homozygote mutant embryos, maternal and paternal pronuclei are different sizes due to failed polar body extrusion in female meiosis II, resulting in the contribution of one extra set of chromosomes by the female. Scale bars represent 10 μm. (D) Quantification of Ab and P1 arrest times of diploid and triploid embryos depleted of zyg-1 by RNAi. Individual measurements are shown with mean (middle bar) and standard deviation (error bars) (**p < 0.01, Student’s t-test). Cell size was the same in diploid and triploid cells (Fig. S1). (E) Still images of zyg-1 (or409) temperature-sensitive embryos shifted to the non-permissive temperature 30 minutes prior to imaging. The top embryo is a non-injected control, the middle embryo is from an adult that had been injected with DNA 5 hours before imaging, and the bottom embryo is from an adult stably transmitting extrachromosomal DNA. For the “+ DNA” embryos, only those embryos in which extra DNA was visible by DIC microscopy (white arrowheads) were included in the quantification (see F). Scale bars represent 10 μm. (F) Quantification of Ab and P1 arrest times of control zyg-1 (or409) embryos (non-injected, “−”), zyg-1 (or409) embryos injected with DNA and imaged shortly after injection (“+ DNA”), and zyg-1 (or409) embryos that stably segregated extrachromosomal arrays (“+ centromeric DNA”). For the latter group, embryos from 3 independent lines were scored. Individual measurements are shown with mean (middle bar) and standard deviation (error bars) (NS, not significant, p > 0.05, and **, p < 0.01, Student’s t-test).
Figure 4
Figure 4. Mad1MDF-1 localization to unattached kinetochores does not depend on cell size
(A) Representative images of nocodazole-treated early stage (top) and late stage (bottom) embryos expressing GFP-Mad1MDF-1 (green) and mCherry-H2B (magenta). Scale bars represent 5 μm. (B) Ratio of relative fluorescence intensities of GFP-Mad1MDF-1 / mCherry-H2B on chromosomes of early (1–4 cell) and late (8–32 cell) stage embryos treated with 50 μM nocodazole. Individual measurements are shown with mean (middle bar) and standard deviation (error bars) (NS, not significant, p > 0.05, Student’s t-test). (C) Representative images of prometaphase or metaphase cells of early and late stage embryos expressing GFP-Mad1MDF-1 (left panel), GFP-Mad2MDF-2 (middle panel) and Apc1MAT-2-GFP (right panel). mCherry-H2B is shown in magenta. For late cell stages (right panels), arrowheads mark cells in prometaphase. Scale bar represents 5 μm. (D) Quantification of fluorescent intensities of cytoplasmic GFP-Mad1MDF-1 (left panel), GFP-Mad2MDF-2 (middle panel) and Apc1MAT-2-GFP (right panel). Regions of cytoplasm outside the mitotic spindle were analyzed, and so these measurements do not include GFP-tagged proteins on the spindle. Individual measurements are shown with mean (middle bar) and standard deviation (error bars) (NS, not significant, p > 0.05, Student’s t-test). AU, arbitrary unit.

Comment in

Similar articles

Cited by

References

    1. Arata Y, Takagi H, Sako Y, Sawa H. Power law relationship between cell cycle duration and cell volume in the early embryonic development of Caenorhabditis elegans. Front Physiol. 2014;5:529. - PMC - PubMed
    1. Chao WC, Kulkarni K, Zhang Z, Kong EH, Barford D. Structure of the mitotic checkpoint complex. Nature. 2012;484:208–213. - PubMed
    1. Chen RH, Shevchenko A, Mann M, Murray AW. Spindle checkpoint protein Xmad1 recruits Xmad2 to unattached kinetochores. J Cell Biol. 1998;143:283–295. - PMC - PubMed
    1. Chen RH, Waters JC, Salmon ED, Murray AW. Association of spindle assembly checkpoint component XMAD2 with unattached kinetochores. Science. 1996;274:242–246. - PubMed
    1. Clute P, Masui Y. Regulation of the appearance of division asynchrony and microtubule-dependent chromosome cycles in Xenopus laevis embryos. Dev Biol. 1995;171:273–285. - PubMed

Publication types

MeSH terms

Substances