

Air Pollution and Pulmonary Tuberculosis: A Nested Case-Control Study among Members of a Northern California Health Plan
- PMID: 26859438
- PMCID: PMC4892908
- DOI: 10.1289/ehp.1408166
Air Pollution and Pulmonary Tuberculosis: A Nested Case-Control Study among Members of a Northern California Health Plan
Abstract
Background: Ecologic analyses, case-case comparisons, and animal experiments suggest positive associations between air pollution and tuberculosis.
Objectives: We evaluated this hypothesis in a large sample, which yielded results that are applicable to the general population.
Methods: We conducted a case-control study nested within a cohort of Kaiser Permanente of Northern California members. All active pulmonary tuberculosis (TB) cases newly diagnosed between 1996 and 2010 (n = 2,309) were matched to two controls (n = 4,604) by age, sex, and race/ethnicity on the index date corresponding with the case diagnosis date. Average individual-level concentrations of carbon monoxide (CO), nitrogen dioxide (NO2), sulfur dioxide (SO2), ozone (O3), and particulate matter with aerodynamic diameter ≤ 2.5 μm (PM2.5) and 10 μm (PM10) for 2 years before diagnosis/entry into the study were estimated using measurements from the California Air Resources Board monitor closest to the participant's residence.
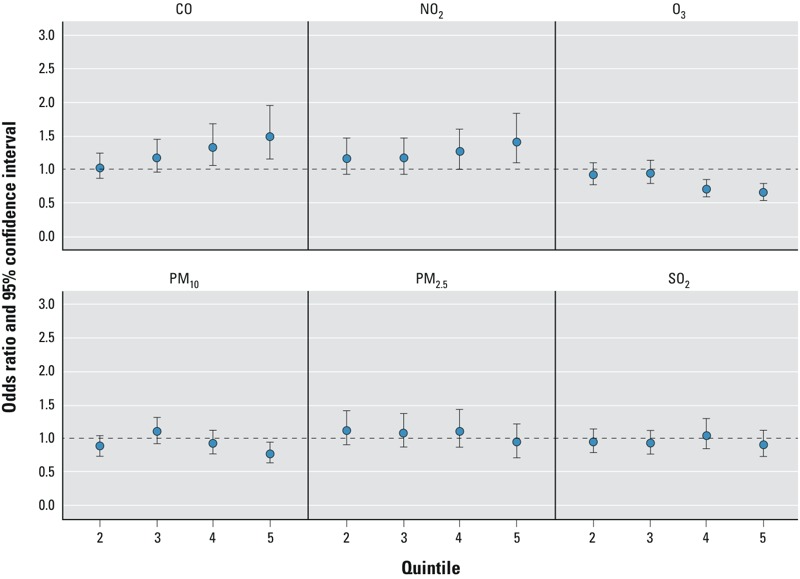
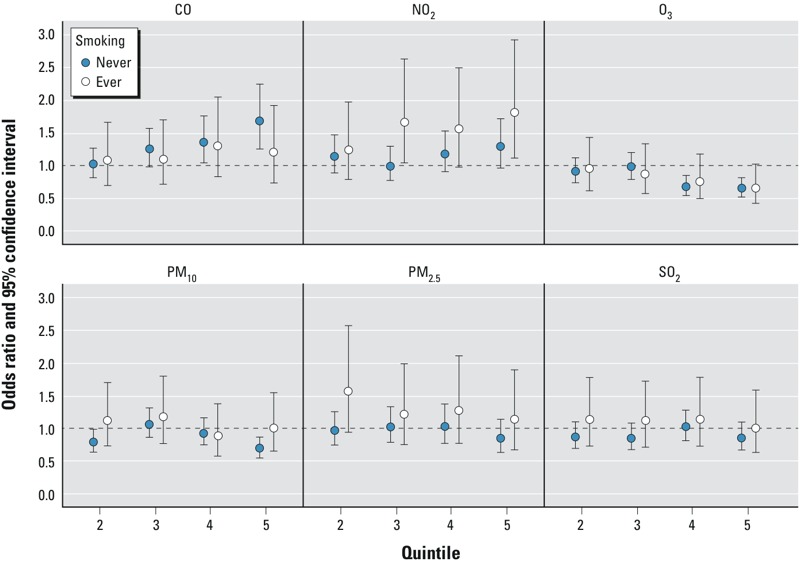
Results: In single-pollutant adjusted conditional logistic regression models, the pulmonary TB odds ratios (95% confidence intervals) for the highest quintile (vs. lowest) were 1.50 (95% CI: 1.15, 1.95) for CO and 1.42 (95% CI: 1.10, 1.84) for NO2. Corresponding estimates were higher among never [1.68 (95% CI: 1.26, 2.24)] than ever [1.19 (95% CI: 0.74, 1.92)] smokers for CO. In contrast, for NO2, estimates were higher among ever [1.81 (95% CI: 1.13, 2.91)] than never [1.29 (95% CI: 0.97, 1.71)] smokers. O3 was inversely associated for smokers [0.66 (95% CI: 0.43, 1.02)] and never smokers [0.65 (95% CI: 0.52, 0.81)]. No other consistent patterns were observed.
Conclusions: In this first, to our knowledge, U.S. nested case-control study on air pollution and pulmonary TB, we observed positive associations with ambient CO and NO2, which require confirmation.
Citation: Smith GS, Van Den Eeden SK, Garcia C, Shan J, Baxter R, Herring AH, Richardson DB, Van Rie A, Emch M, Gammon MD. 2016. Air pollution and pulmonary tuberculosis: a nested case-control study among members of a Northern California health plan. Environ Health Perspect 124:761-768; http://dx.doi.org/10.1289/ehp.1408166.
Conflict of interest statement
The authors declare they have no actual or potential competing financial interests.
Figures
References
-
- Brunekreef B, Beelen R, Hoek G, Schouten L, Bausch-Goldbohm S, Fischer P, et al. Effects of long-term exposure on respiratory and cardiovascular mortality in the Netherlands: the NLCS-AIR Study. Res Rep Health Eff Inst. 2009;139:5–71. - PubMed
-
- CDC (Centers for Disease Control and Prevention) Fact Sheets. Tuberculosis: General Information. 2011 Available: http://www.cdc.gov/tb/publications/factsheets/general/tb.htm [accessed 9 May 2012]
-
- Clapp LJ, Jenkin ME. Analysis of the relationship between ambient levels of O3, NO2 and NO as a function of NOx in the UK. Atmos Environ. 2001;35:6391–6405.
Publication types
MeSH terms
Substances
Grants and funding
LinkOut - more resources
Full Text Sources
Other Literature Sources
Medical
Miscellaneous
