. 2016 Feb 8;29(2):186-200.
doi: 10.1016/j.ccell.2015.12.013.

Truncating Erythropoietin Receptor Rearrangements in Acute Lymphoblastic Leukemia

Affiliations

Truncating Erythropoietin Receptor Rearrangements in Acute Lymphoblastic Leukemia

Ilaria Iacobucci et al. Cancer Cell. .

Abstract

Chromosomal rearrangements are a hallmark of acute lymphoblastic leukemia (ALL) and are important ALL initiating events. We describe four different rearrangements of the erythropoietin receptor gene EPOR in Philadelphia chromosome-like (Ph-like) ALL. All of these rearrangements result in truncation of the cytoplasmic tail of EPOR at residues similar to those mutated in primary familial congenital polycythemia, with preservation of the proximal tyrosine essential for receptor activation and loss of distal regulatory residues. This resulted in deregulated EPOR expression, hypersensitivity to erythropoietin stimulation, and heightened JAK-STAT activation. Expression of truncated EPOR in mouse B cell progenitors induced ALL in vivo. Human leukemic cells with EPOR rearrangements were sensitive to JAK-STAT inhibition, suggesting a therapeutic option in high-risk ALL.


Figures

Figure 1
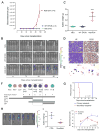
Figure 1. EPOR rearrangements in Ph-like ALL
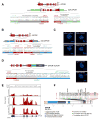
(A, B) Schematic representation of cryptic insertion of EPOR within the immunoglobulin heavy chain (IGH) and kappa chain (IGK) loci in SJBALL020100 (A) and SJBALL020084 (B) and Sanger sequencing results. (C) FISH assay demonstrating rearrangement of EPOR in SJBALL020649 and SJBALL021748. Scale bars represent 10 μm. (D) Schematic representation of the fusion between EPOR exon 8 (red) and the LAIR1 upstream region (blue) in SJBALL021080 and Sanger sequencing electropherogram (left) and FISH assay of EPOR (right). The two right panels show the same cell with bottom panel having additional probes bracketing the 19q break point. Scale bars represent 10 μm. (E) Plot of read depth from RNA-seq showing EPOR expression in a representative case of ETV6-RUNX1-positive ALL and two cases of EPOR-rearranged ALL. Arrows indicate the EPOR breakpoints. The last translated amino acids, A411 and Q434 respectively, are shown following by the * sign. (F) Location of EPOR truncations occurring in Ph-like ALL and in PFCP (from http://www.erythrocytosis.org/scid/polycythemias_en/) (Kralovics and Prchal, 2001; Bento et al., 2014). Common truncation sites between Ph-like ALL and PFCP are in bold. Key tyrosine (Y) residues in EPOR are in red (NP_000112.1). See also Figure S1, Table S1 and Table S2.
Figure 2
Figure 2. EPOR expression
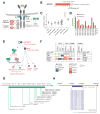
(A) A scematic representation of EPOR, its regulation, and its signaling. The red box indicates the cytoplasmic part of the receptor that is lost with EPOR-rearrangements. (B) A schematic representation of EPOR mRNA and regions for quantitative RT-PCR for its expression, the junction of exons 6 and 7 (red) in the common retained EPOR region and within exon 8 (grey) distal to the truncation. (C) EPOR expression was assessed in 134 cases from different ALL subtypes including T-lineage ALL (12), BCR-ABL1 ALL (14), hypodiploid B-ALL (7), hyperdiploid B-ALL (5), B-other ALL (22), non-EPOR Ph-like (51), Ph-like EPOR-rearranged (12) and ETV6-RUNX1 ALL cases (11).. The mean expression is shown by the horizontal line in the scatter dot plot. (D) Comparison of expression levels of EPOR exon 6–7 v. exon 8. An ETV6-RUNX1-positive ALL case is used as positive control for the expression of both exon 6–7 and exon 8 as it expresses full-length EPOR; a BCR-ABL1-positive ALL case is used as negative control. Results show the mean from two replicates. (E) Schematic representation of human hematopoietic hierarchy showing the hematopoietic stem cell (HSC) and the multipotent progenitor (MPP) fraction (CD34+CD38CD45RA), the multilymphoid progenitor (MLP) cell fraction (CD34+CD38CD45RA+), the common myeloid progenitor (CMP) population (CD34+CD38+CD7CD10), which includes the megakaryocyte erythroid progenitor (MEP) and the granulocyte monocyte progenitor (GMP) (CD34+CD38+CD7CD10CD135+CD45RA+) and the mature cells: myeloid cells (CD33+) including granulocytes and monocytes, B-cells (CD45brightCD19+) and T-cells (CD3+). In the scheme all cell populations highlighted in red were sorted and analyzed for EPOR rearrangements and additional alterations. Additional population sorted only in the remission sample (GMP fraction) is shown in blue. Blasts were defined as CD19+CD45dim. (F) Summary of the presence of EPOR rearrangements and additional somatic alterations in isolated stem/progenitor, mature and blast cell populations from 3 EPOR-rearranged Ph-like ALL cases at diagnosis (left) and at remission from 1 case (right) as determined by MiSeq sequencing and ddPCR. All putative missense and silent mutations identified by analysis of RNA-seq data without matching germline data that were also identified by MiSeq in normal T-cells were considered germline and not included in this schema. (G) Schematic representation of the breakpoints occurring in EPOR-rearranged Ph-like ALL in the IGH locus. They span a region of 732.8 kb. (H) Schematic representation of the breakpoints occurring in EPOR-rearranged Ph-like ALL in EPOR exon eight. They are clustered in a hot spot region including 125 nucleotides with a semi-conserved heptamer immediately downstream to all breakpoints. Recombination signal sequences (RSS) heptamer sequences are shown in red and nonamer sequences are in blue. Abbreviations: mut, mutation; het, heterozygous, homo, homozygous; neg, negative; MAF, minor allele frequency; ddPCR, droplet digital PCR; ex: exon; ****, p<0.0001. See also Figure S2, Table S3 and Table S4.
Figure 3
Figure 3. Expression of EPOR in IL-3 dependent Ba/F3 mouse hematopoietic cell lines
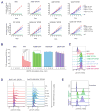
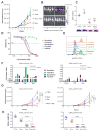
(A) Ba/F3 cells were transduced with empty vector (MIG) or vectors that express the wild-type EPOR, EPOR*, or EPOR-IGH*/-IGK*. Cells were grown with or without IL-3 and with increasing concentrations of rhEPO (0.01 U/mL to 10 U/ml) and cumulative cell numbers were measured. Data are means ± S.D. from triplicates from two independent experiments. (B) Ba/F3 cells expressing the empty vector, wild-type or indicated truncated EPOR were stimulated with rhEPO and cell surface EPOR and pSTAT5 were assessed by flow cytometric analysis at indicated time points since stimulation. Bars express the mean ± S.D. from three independent experiments. (C) Flow cytometric analysis of STAT5 phosphorylation after rhEPO stimulation (rhEPO 1 U/ml for 15 minutes) in cells expressing indicated EPOR. Dotted lines represent EPOR-IGH*/IGK*. (D) Ba/F3 cells expressing wild-type or truncated EPOR were stimulated over time with rhEPO and pSTAT5 was assessed by flow cytometry. (E) Ba/F3 cells were untreated (−) or treated (+) with ruxolitinib (1 μM) for 1 hour and levels of phosphorylated STAT5 were assessed by phosphoflow cytometric analysis. Abbreviations: NF, no factor; rhEPO, recombinant human erythropoietin; min, minutes; ***, 0.0001 < p < 0.001; ****, p <0.0001. See also Figure S3.
Figure 4
Figure 4. Surface expression of EPOR and STAT5 phosphorylation in PDX cells and human B-ALL cell lines
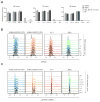
(A) EPOR-rearranged PDX cells were harvested and cultured ex vivo in media containing indicated concentrations of recombinant mouse erythropoietin (rmEPO) or recombinant human erythropoietin (rhEPO), a cytokine cocktail (IL-7, SCF, FLT3-L), or no exogenous cytokine (NF). Proliferation of PDX cells over time was measured. Data are means ± S.D. from triplicates from two independent experiments. (B) EPOR-rearranged PDX cells and human B-ALL cell lines known to overexpress EPOR were stimulated with rhEPO (10 U/ml) and cell surface EPOR was assessed by flow cytometric analysis at indicated time points after stimulation. (C) EPOR-rearranged PDX cells and human B-ALL cell lines known to overexpress EPOR were stimulated with rhEPO (10 U/ml) and phosphorylation of STAT5 was assessed by flow cytometric analysis at different time points since stimulation. Abbreviations: NF, no factor; CKs, cytokines; min, minutes; hr, hours. See also Figure S4.
Figure 5
Figure 5. Colony forming assay in Epor−/− fetal liver cells and clonogenic assay in lin- bone marrow cells
(A) Embryonic day 12.5 Epor−/− fetal liver cells were isolated and transduced with empty vector (MIG) or vectors expressing WT EPOR or truncated EPOR (A396-IGH* or I428-IGH*) that are representative of the different locations of truncation in the receptor. Embryonic day 12.5 untransduced (UT) Epor+/+ fetal liver cells were isolated and used as positive control in the BFU-E assay. Colony morphology is shown. Scale bars represent 500 μm. (B) Erythroid colonies were harvested from culture dishes in (A), stained for CD71 and Ter119 antigens and analyzed by flow cytometry. (C) Clonogenic assays of lineage-negative mouse bone marrow cells expressing TR or WT EPOR or transduced with empty vector (MIG). Columns show means of three replicates ± S.D. (D) Representative colony morphology and cytospins from TR EPOR-expressing cells are shown. Scale bars represent 500 μm for colony morphology and 10 μm for cytospin. (E) Cells harvested from colony-forming assays after two or more replatings were subjected to flow cytometry and representative immunophenotype is showed.
Figure 6
Figure 6. Leukemia development in mice transplanted with Arf−/− primary pre-B cells expressing truncated EPOR
(A) Leukemia development in mice transplanted with indicated cells was assessed by bioluminescence analysis performed every two weeks for a total of 14 weeks. Results are means ± S.D. from five mice per group. (B) Bioluminescent images were captured after 14, 70, 84 and 98 days following transplantation from each group. One mouse in the truncated EPOR group did not show detectable engraftment. (C) Spleen weight at the end of study (112th day) in mice transplanted with indicated cells. The mean expression is shown by the horizontal line in the scatter dot plot and the error bars represent the S.D. ****, p < 0.0001. (D) Bone marrow sections from two representative C57Bl/6 mice (top and bottom row, respectively) transplanted with Arf−/− primary pre-B cells expressing truncated EPOR were stained with hematoxylin-eosin (HE) or labeled with an antibody specific for B220. Scale bars represent 50 μm. (E) Representative cytospins from two representative mice (right and left panels) with EPOR I428-IGH*. Scale bars represent 10 μm. (F) A schematic representation of Hardy stages (Hardy and Shinton, 2004) of cell surface markers expressed during B cell development. Abbreviations: HSC, hematopoietic stem cells; MLP, multilineage progenitor; CLP, common lymphoid progenitor; NF B, newly formed B cells; Fo B, mature follicular B cells. (G) Survival curves in primary and secondary recipients. (H) Bioluminescent images of secondary recipients 14 days following transplantation. (I) Spleen weight at the end of the treatment study (left panel) and the bioluminescence analysis results performed every week (right panel). The mean expression is shown by the horizontal line in the scatter dot plot and the error bars represent the S.D. ***, 0.0001 < p < 0.001. See also Figure S5.
Figure 7
Figure 7. Sensitivity of EPOR-rearranged Ph-like ALL to JAK1/2 inhibition
(A) In vivo response of an EPOR-rearranged xenograft to ruxolitinib, darbepoietin alpha, combination ruxolitinib and darbepoetin or vehicle (5 mice per group). Error bars represent means ± S.D. P values are from ANOVA test and show the results from the comparison of each treated group versus the control group. (B) In vivo luciferase imaging showing leukemia growth in mice treated with ruxolitinib compared to control mice. (C) Spleen weights of mice treated as indicated at the end of the study. P values are from ANOVA test and show the results from the comparison of each treated group versus the control group. The mean expression is shown by the horizontal line in the scatter dot plot and the error bars represent the S.D. (D) Ex vivo cytotoxicity assays of IGH-EPOR human leukemic cells (YFP+CD45+CD19+) harvested from xenografted mice and treated with imatinib and the JAK inhibitors ruxolitinib, fedratinib, momelotinib or pacritinib. Error bars represent means ± S.D. (E) Ex vivo phospho-STAT5 signaling analysis in engrafted leukemia cells (YFP+CD45+CD19+) treated with JAK1/2 inhibitors (1 μM for 1 hour). (F) Ex vivo combinatorial studies of JAK1/2 inhibitor and chemotherapeutic agents in two EPOR-rearranged PDX models. Plot of combination index values are from Calcusyn analysis. (G) In vivo response of two EPOR-rearranged xenografts to ruxolitinib, dexamethasone, combination of ruxolitinib and dexamethasone or vehicle (5 mice per group). Error bars represent means ± S.D. P values are from ANOVA (Tukey’s multiple comparisons test). (H) Spleen weights in mice treated as indicated at the end of the study. The mean expression is shown by the horizontal line in the scatter dot plot and the error bars represent the S.D. Abbreviations: EPO, erythropoietin; CTRL, vehicle treated control mice; Dauno, Daunorubicin; VNC, Vincristine; Dex, Dexamethasone. EPO, erythropoietin; CTRL, vehicle treated control mice; ruxo, ruxolitinib; **, 0.001 < p < 0.01; ***, 0.0001 < p < 0.001; ****, p < 0.0001. See also Figure S6.

Similar articles

Cited by

References

    1. Alpar D, Wren D, Ermini L, Mansur MB, van Delft FW, Bateman CM, Titley I, Kearney L, Szczepanski T, Gonzalez D, et al. Clonal origins of ETV6-RUNX1(+) acute lymphoblastic leukemia: studies in monozygotic twins. Leukemia. 2015;29:839–846. - PubMed
    1. Bento C, Percy MJ, Gardie B, Maia TM, van Wijk R, Perrotta S, Della Ragione F, Almeida H, Rossi C, Girodon F, et al. Genetic basis of congenital erythrocytosis: mutation update and online databases. Hum Mutat. 2014;35:15–26. - PubMed
    1. Bulut GB, Sulahian R, Yao H, Huang LJ. Cbl ubiquitination of p85 is essential for Epo-induced EpoR endocytosis. Blood. 2013;122:3964–3972. - PMC - PubMed
    1. de la Chapelle A, Traskelin AL, Juvonen E. Truncated erythropoietin receptor causes dominantly inherited benign human erythrocytosis. Proc Natl Acad Sci U S A. 1993;90:4495–4499. - PMC - PubMed
    1. Den Boer ML, van Slegtenhorst M, De Menezes RX, Cheok MH, Buijs-Gladdines JG, Peters ST, Van Zutven LJ, Beverloo HB, Van der Spek PJ, Escherich G, et al. A subtype of childhood acute lymphoblastic leukaemia with poor treatment outcome: a genome-wide classification study. Lancet Oncol. 2009;10:125–134. - PMC - PubMed

Publication types

MeSH terms

Substances