. 2016 Feb 8;29(2):201-13.
doi: 10.1016/j.ccell.2016.01.005.

Serine/Threonine Kinase MLK4 Determines Mesenchymal Identity in Glioma Stem Cells in an NF-κB-dependent Manner

Affiliations

Serine/Threonine Kinase MLK4 Determines Mesenchymal Identity in Glioma Stem Cells in an NF-κB-dependent Manner

Sung-Hak Kim et al. Cancer Cell. .

Abstract

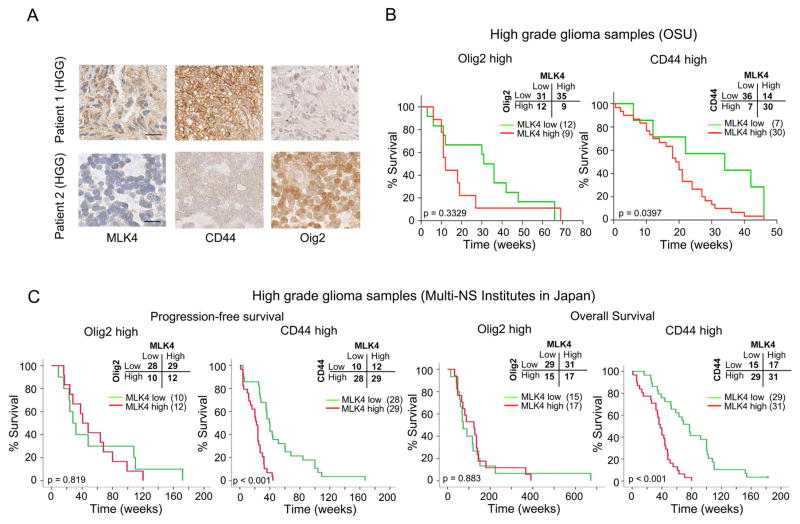
Activation of nuclear factor κB (NF-κB) induces mesenchymal (MES) transdifferentiation and radioresistance in glioma stem cells (GSCs), but molecular mechanisms for NF-κB activation in GSCs are currently unknown. Here, we report that mixed lineage kinase 4 (MLK4) is overexpressed in MES but not proneural (PN) GSCs. Silencing MLK4 suppresses self-renewal, motility, tumorigenesis, and radioresistance of MES GSCs via a loss of the MES signature. MLK4 binds and phosphorylates the NF-κB regulator IKKα, leading to activation of NF-κB signaling in GSCs. MLK4 expression is inversely correlated with patient prognosis in MES, but not PN high-grade gliomas. Collectively, our results uncover MLK4 as an upstream regulator of NF-κB signaling and a potential molecular target for the MES subtype of glioblastomas.

Keywords: cancer stem cell; epithelial-to-mesenchymal transition; glioblastoma; proneural-mesenchymal transition.


Figures

Figure 1
Figure 1. MLK4 is highly expressed in MES GSCs
(A) Heatmap showing differentially expressed kinase-encoding genes in Proneural (PN), Mesenchymal (MES) glioma sphere cells, neural progenitors, and normal astrocytes. (B) Average fold change of cell number in SubG1 phase upon target gene knockdown in MES 83 and PN 528 glioma spheres. Error bar represents standard deviation (SD) from 5 independent shRNAs for each gene. *p < 0.05. shNT, Non-Targeting control shRNA. (C) Cell cycle analysis in glioma spheres with MLK4 knockdown (shMLK4; red) by PI staining using FACS. shNT as control (blue). (D) Ranking of MLK4 among 349 kinase genes according to the fold difference of expression in MES glioma spheres relative to neural progenitors or normal astrocytes. (E) Immunoblot (IB) analysis of MLK4 in glioma spheres. β-actin as internal control. (F) Immunofluorescent (IF) staining for MLK4 expression in glioma spheres. MLK4 was labeled in green. Nuclei were counterstained with DAPI (blue). Scale bar represents 20 μm. (G) IF staining of MLK4 and MES marker CD44 in glioma spheres. MLK4 was labeled in red and CD44 in green. Nuclei were counterstained with DAPI (blue). Scale bar represents 20 μm. (H) FACS plots of MLK4 and CD44 in PN and MES glioma spheres. (I) Quantitative RT-PCR (qRT-PCR) analysis of mRNA expression of MLK4 and ALDH1A3 in ALDEFLUOR-positive and ALDEFLUOR-negative subpopulations of MES 83 glioma spheres. Data are means ± SD (n = 3). ***p < 0.001. (J) MLK4 protein expression in ALDEFLUOR-positive and ALDEFLUOR-negative subpopulations of MES 83 glioma spheres using immunoblotting. β-actin as internal control. (K) qRT-PCR analysis of mRNA expression of MLK4 and an osteogenic differentiation marker Runx2 in MES 83 glioma spheres during osteogenic differentiation induction. Data are means ± SD (n = 3). *p < 0.05; **p < 0.01; ***p < 0.001. See also Figure S1, Table S1 and S2.
Figure 2
Figure 2. Depletion of MLK4 attenuates a set of MES GSC phenotypes
(A) Effects of MLK4 knockdown by shRNA (shMLK_1 or shMLK_2) and MLK4 knockout (KO) by CRISPR/Cas9 system on cell growth in MES 83 glioma spheres analyzed by AlamarBlue staining. Results were expressed as relative fluorescence units (RFU). Data are means ± SD (n = 6). ***p < 0.001. (B) Representative images of EdU incorporation assays (left) and quantification of EdU positive cells (right) in MES 83 glioma spheres expressing shNT or shMLK4. Cells in green represent EdU positive cells. Nuclei were counterstained with DAPI (blue). Scale bar represents 20 μm. *p < 0.05. (C) FACS plots of Annexin V and PI staining in MES 83 and PN 528 glioma spheres expressing shNT, shMLK4_1, or shMLK_2. (D) Effects of or shMLK4_2 and MLK4 KO on sphere forming frequency of MES 83 glioma cells determined by limiting dilution assays. Stem cell frequency was calculated by ELDA analysis. Data are means ± SD (n = 18) ***p < 0.001. See also Figure S2.
Figure 3
Figure 3. Silencing MLK4 in MES GSCs suppressed tumor growth and increased mouse survival
(A) Representative hematoxylin and eosin (H&E) staining of mouse brains harvested on day 15 (MES 83) or day 58 (MES 267) after transplantation of MES glioma spheres expressing shNT, shMLK_1, or shMLK_2. Scale bars represent 2 mm. (B) Kaplan-Meier survival curves of mice intracranially transplanted with MES 83 or 267 glioma spheres that were infected with indicated shRNAs (n = 7). Tables show median survival of mice.
Figure 4
Figure 4. Mesenchymal phenotypes in glioma spheres are dependent on MLK4
(A) Effects of MLK4 knockdown (shMLK4_1 or shMLK4_2) on the motility of MES 83 glioma spheres. Representative track pattern images of individual MES 83 cells are shown (upper). Quantification shows the effect of shMLK_1 or shMLK4_2 on single-clone migration velocity (lower). Scale bar represents 200 μm. Data are means ± SD. ***p < 0.001. (B) Effects of MLK4 knockdown (shMLK4_1 or shMLK4_2) on the glycolysis of MES 83 spheres were measured by recording the extracellular acidification rate (ECAR) in a Seahorse Bioanalyzer. Data are means ± SD. **p < 0.01. (C) qRT- PCR analysis for gene expression of MES markers including MET, WT-1, BCL2A1, Vimentin, and Snail in MES 83 glioma spheres expressing shNT or shMLK4 and in PN 528 glioma spheres expressing control vector or kinase active mutant of MLK4 (R470C). Data are means ± SD (n = 3). **p < 0.01; ***p < 0.001. (D) GSEA plot of TCGA MES gene signatures in shNT or shMLK4 of glioma spheres. Gene expression profile data are obtained by cDNA microarray using with MES glioma spheres expressing shNT or shMLK4. Gene sets for MES GBM defined by the TCGA MES signature were used for this analysis (Verhaak et al., 2010). The normalized enrichment scores (NES) is shown in the plot. (E) Effects of MLK4 KO and MLK4 (R470C) overexpression in glioma spheres on CD44 expression by FACS analysis. The basal levels were determined by the results with the vector control. (F) IF analysis of Vimentin expression in GBM xenografts derived from MES 83 and 267 glioma spheres with or without MLK4 knockdown. Vimentin was labeled in red. Nuclei were counterstained with DAPI (blue). Scale bar represents 50 μm. See also Figure S3, Movies S1, and S2.
Figure 5
Figure 5. MLK4 binds and phosphorylates IKKa resulting in increased NF- B activity in MES glioma spheres
(A) IB analysis of p-IKKα/β (S176/180), IKKα, and p-IκB (S32) expression in MES 83 glioma spheres expressing shNT or shMLK4. (B) Effects of MLK4 knockdown on NF-κB response element driven Gaussia luciferase(NF-Gluc) activity in MES 83 glioma spheres. Data are means ± SD (n = 3). **p < 0.01. (C) Gel shift assay (EMSA) with the nuclear extracts from MES 83 glioma spheres expressing shNT or shMLK4. Nuclear extracts were prepared and EMSA was performed with a radiolabeled oligonucleotide containing an NFκB-binding site. (D) Immunoprecipitation (IP) analysis with IKKα antibody followed by immunoblot for MLK4 showing the IKKα-MLK4 protein complex in MES 83 glioma spheres. Whole cell lysates as input positive control and pull-down with IgG as negative control. (E) In vitro kinase assay showing MLK4 phosphorylates IKKα, but not IKKβ in a dose dependent manner. After incubation with purified baculovirus-expressed IKKα or IKKβ and MLK4 recombinant proteins including ATP, immunoblot blot was performed with anti p-Serine antibody. (F) Effects of IKKα siRNA knockdown in PN 528 glioma spheres on MLK4–mediated NF-Gluc activity. Data are means ± SD (n = 3). **p < 0.01; ##p < 0.01. (G) GSEA showing NF-κB gene signature is reduced in MLK4 depleted MES glioma spheres. The normalized enrichment scores (NES) is shown in the plot. (H-I) IB analysis of p-IKKα/β (H) and NF-Gluc reporter activity (I) in vector or kinase-inactive MLK4 (K151A) in MES 83 glioma spheres. Data are means ± SD. *p < 0.05. (J) Limiting dilution neurosphere forming assay in MES 83 glioma spheres with control vector or MLK4 (K151A) overexpression. Stem cell frequency was calculated by ELDA analysis. ***p < 0.001. (K-L) Kaplan-Meier survival curves (K) and representative H&E staining images (L) of mice intracranially injected MES 83 glioma spheres with vector or MLK4 (K151A). Arrows indicate tumors. Scale bar represents 2 mm (upper) and 100 μm (lower). (M) Representative IHC imaging for CD44 and Vimentin in vector- or MLK4 (K151A)-overexpressing MES 83 derived tumors. Scale bar represents 20 μm. See also Figure S4.
Figure 6
Figure 6. The effects of MLK4 silencing together with irradiation in PN GSC-derived xenograft tumors
(A) qRT-PCR analysis for MLK4 and CD44 expression in response to 5 Gy irradiation in PN 157 and PN 84 glioma spheres in vitro. **p < 0.01. (B) NF-κB reporter activities in MES 83 glioma spheres with lentiviral infection of shNT or shMLK4 in response to irradiation in vitro. **p < 0.01 in shNT vs. shNT + irradiation; ##p < 0.01 or #p < 0.05 in shNT vs. shMLK4 + Irradiation. (C) Representative bio-luminescence images of shNT or shMLK4 infected GSC 23 transduced with pCignal lenti-CMV-luc injected intracranially into Foxn1nu mice. Mice were imaged at 2–3 weeks after implantation, after which the radiation group received four cycles of 2.5 Gy IR on consecutive days (n = 6 in each group). (D) Kaplan-Meier survival curves of mice intracranially transplanted GSC 23 with shNT or shMLK4 in response to irradiation. Arrows indicate the time of irradiation. (E) Kaplan-Meier survival curves of tumor-burden mice intracranially transplanted GSC 8-11 with empty or MLK4 overexpression in response to irradiation. Irradiation was performed on week 3 after implantation for 4 consecutive days at 2.5 Gy/day. See also Figure S5.
Figure 7
Figure 7. MLK4 expression correlates with post-surgical poor survival of patients with MES GBM
(A) Immunohistochemistry of human high grade glioma (HGG) samples for MLK4, CD44, and Olig2. Scale bar represents 20 μm. (B) Kaplan Meier curve showing overall survival of HGG patients divided based on MLK4 expression in Olig2high PN-type (left) or CD44high MES-type (right) tumors with the exploratory cohort treated in the Department of Neurosurgery at OSU. (C) Kaplan Meier curve showing progression-free survival and overall survival of GBM patients divided based on MLK4 expression in Olig2high PN-type (left) or CD44high MES-type (right) tumors with the validation cohort treated in the Department of Neurosurgery in 4 Universities in Japan (designated as Multi-NS institutes).

References

    1. Abi Saab WF, Brown MS, Chadee DN. MLK4beta functions as a negative regulator of MAPK signaling and cell invasion. Oncogenesis. 2012;1:e6. - PMC - PubMed
    1. Badr CE, Niers JM, Tjon-Kon-Fat LA, Noske DP, Wurdinger T, Tannous BA. Real-time monitoring of nuclear factor kappaB activity in cultured cells and in animal models. Mol Imaging. 2009;8:278–290. - PMC - PubMed
    1. Bao S, Wu Q, McLendon RE, Hao Y, Shi Q, Hjelmeland AB, Dewhirst MW, Bigner DD, Rich JN. Glioma stem cells promote radioresistance by preferential activation of the DNA damage response. Nature. 2006;444:756–760. - PubMed
    1. Baud V, Karin M. Is NF-kappaB a good target for cancer therapy? Hopes and pitfalls. Nat Rev Drug Discov. 2009;8:33–40. - PMC - PubMed
    1. Beier D, Schulz JB, Beier CP. Chemoresistance of glioblastoma cancer stem cells--much more complex than expected. Mol Cancer. 2011;10:128. - PMC - PubMed

Publication types