. 2016 Mar 1;7(9):10255-70.
doi: 10.18632/oncotarget.7182.

Invasive mouse gastric adenocarcinomas arising from Lgr5+ stem cells are dependent on crosstalk between the Hedgehog/GLI2 and mTOR pathways

Affiliations

Invasive mouse gastric adenocarcinomas arising from Lgr5+ stem cells are dependent on crosstalk between the Hedgehog/GLI2 and mTOR pathways

Li-Jyun Syu et al. Oncotarget. .

Abstract

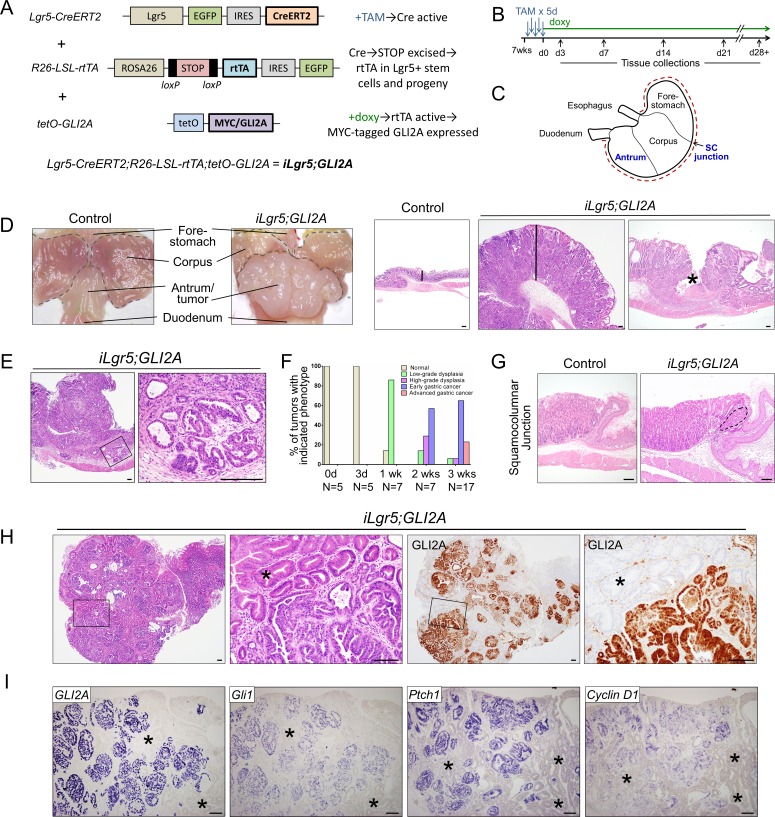
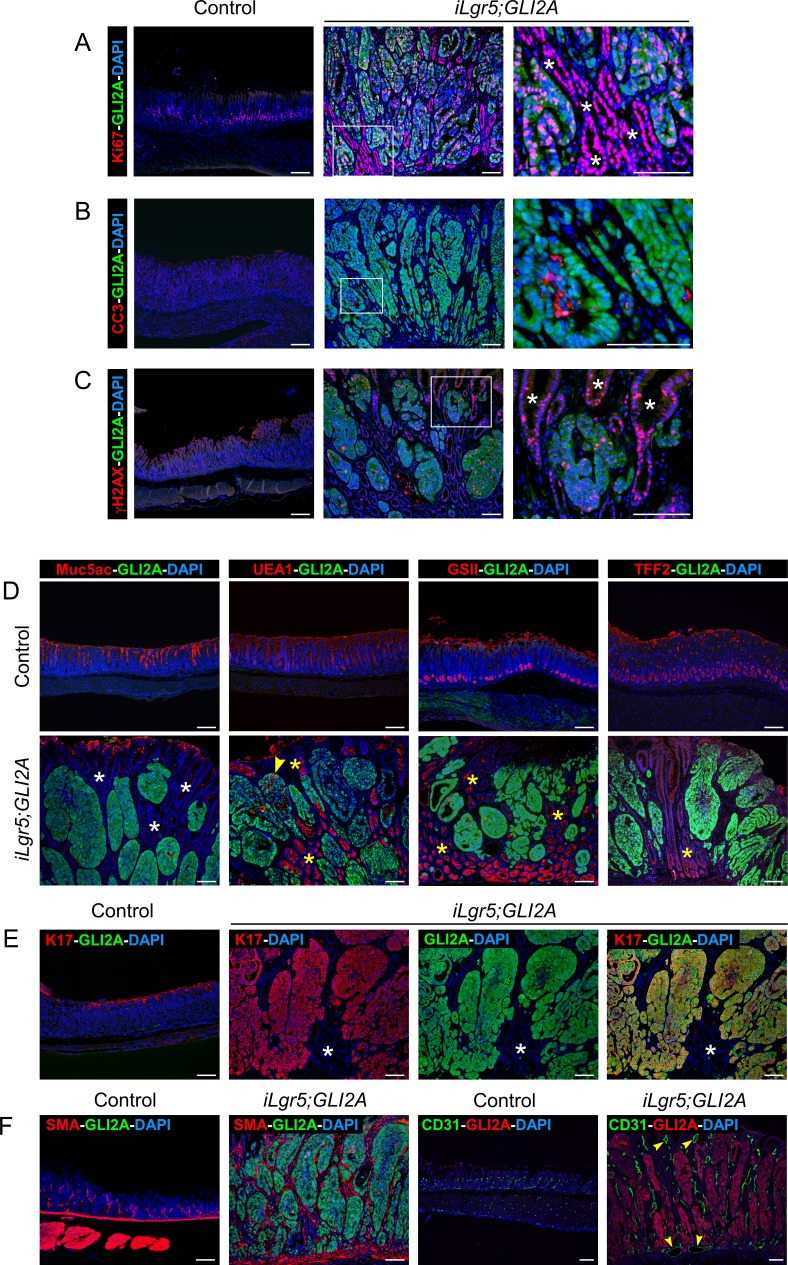
Gastric adenocarcinoma is the third most common cause of cancer-related death worldwide. Here we report a novel, highly-penetrant mouse model of invasive gastric cancer arising from deregulated Hedgehog/Gli2 signaling targeted to Lgr5-expressing stem cells in adult stomach. Tumor development progressed rapidly: three weeks after inducing the Hh pathway oncogene GLI2A, 65% of mice harbored in situ gastric cancer, and an additional 23% of mice had locally invasive tumors. Advanced mouse gastric tumors had multiple features in common with human gastric adenocarcinomas, including characteristic histological changes, expression of RNA and protein markers, and the presence of major inflammatory and stromal cell populations. A subset of tumor cells underwent epithelial-mesenchymal transition, likely mediated by focal activation of canonical Wnt signaling and Snail1 induction. Strikingly, mTOR pathway activation, based on pS6 expression, was robustly activated in mouse gastric adenocarcinomas from the earliest stages of tumor development, and treatment with rapamycin impaired tumor growth. GLI2A-expressing epithelial cells were detected transiently in intestine, which also contains Lgr5+ stem cells, but they did not give rise to epithelial tumors in this organ. These findings establish that deregulated activation of Hedgehog/Gli2 signaling in Lgr5-expressing stem cells is sufficient to drive gastric adenocarcinoma development in mice, identify a critical requirement for mTOR signaling in the pathogenesis of these tumors, and underscore the importance of tissue context in defining stem cell responsiveness to oncogenic stimuli.

Keywords: GLI2; Lgr5; gastric cancer; mTOR; stem cells.


Conflict of interest statement

CONFLICTS OF INTEREST

AAD served as member of a scientific advisory board for Novartis.

Figures

Figure 1
Figure 1. GLI2A expression in Lgr5+ stem cells drives rapid development of invasive gastric adenocarcinoma
A. Triple-transgenic mouse model, which includes tamoxifen regulated Lgr5-CreERT2 allele and doxycycline-regulated tet transactivator allele, to achieve tight, conditional GLI2A expression in adult iLgr5;GLI2A mice. B. General scheme for tamoxifen (TAM) dosing and doxy treatment. C. Stomach compartments and regions, with blue text indicating where the Lgr5 promoter is active. Red dashed line along greater curvature indicates where stomach was cut to expose mucosa (D) and prepare tissue for sectioning. D. Stomach harvested after 3 weeks of GLI2A induction contained large polypoid tumors in antrum that histologically resemble human gastric adenocarcinomas. Vertical lines in right panels illustrate marked thickening of tumor relative to control antral mucosa, and the asterisk indicates ulceration. E. Invasion of tumor cells into the submucosa with formation of atypical gland-like structures. F. Histologic scoring showing rapid neoplastic progression in iLgr5;GLI2A mice, with 88% of mice exhibiting either early or advanced gastric cancer at 3 weeks. G. Early tumor development (dashed line) near the squamocolumnar junction. H. Full-blown gastric tumors showed histological heterogeneity with two distinct epithelial morphologies: highly disorganized, atypical-appearing cells that express GLI2A, with neighboring GLI2A-negative hyperplastic antral glands (asterisk). I. RNA in situ hybridization detected canonical Hh target genes (Gli1, Ptch1, & Cyclin D1) in GLI2A-expressing, but not GLI2-negative (asterisks), tumor epithelium. Scale bars: 100 μm.
Figure 2
Figure 2. Proliferation and lineage marker expression in GLI2A-driven gastric adenocarcinomas
A. Double-immunostaining for Ki67 and GLI2A revealed widespread proliferation in GLI2A-expressing gastric tumor cells as well as neighboring GLI2A-negative gastric epithelial cells (white asterisks). B. Increased apoptosis, based on immunostaining for cleaved caspase 3 (CC3), was detected in a subset of GLI2A-expressing gastric tumor cells. C. DNA damage was detected both in GLI2A-expressing tumor cells and GLI2A-negative hyperplastic gastric epithelium (white asterisks) by immunostaining for γH2AX. D. Expression of gastric mucins was detected infrequently (arrowhead) in GLI2A-expressing tumor cells, whereas hyperplastic GLI2A-negative gastric epithelium frequently expressed Tff2 and mucins detected by lectins UEA1 and GSII (yellow asterisks), but not Muc5ac (white asterisks). E. Co-localization of K17 and GLI2A in nearly all gastric tumor cells. Asterisks show GLI2-negative epithelia which do not express K17. F. Immunostaining for either SMA or CD31 revealed an increased number of myofibroblasts and blood vessels, respectively. Large vessels indicated with arrowheads. Scale bars: 100 μm.
Figure 3
Figure 3. EMT is associated with canonical Wnt/β-catenin signaling and Snail1 expression
A. Histology of gastric tumors in two left panels shows dysplastic epithelial cells (dashed lines), contiguous mesenchymal-appearing cells (single asterisk in low mag, arrowheads in high mag images), and hyperplastic epithelium (double asterisks). Two right panels show another representative tumor with mesenchymal-appearing region (asterisk). B. Reduced or undetectable expression of the epithelial marker E-cadherin (Ecad) in GLI2A-expressing tumors cells in regions with presumed EMT (asterisks). C. Lower left panel shows loss of Ecad expression in region of early EMT (dashes lines), with only residual staining in a few cells (arrowheads). Neighboring sections show appearance of SMA and vimentin with occasional co-expression of Ecad and vimentin (arrowheads). D. Mesenchymal-appearing cells (asterisks) in tumor allografts grown in nude mice. Ecad is lost in GLI2A-expressing mesenchymal cells. E. Transcripts encoding EMT markers were measured by qRT-PCR in RNA isolated from control antra (N = 8) and iLgr5;GLI2A gastric tumors (N = 8). Data are expressed as means +/− SEM (**P = 0.0019 and ***P = 0.0002). F. Canonical Wnt signaling restricted to regions of EMT, based on immunostaining showing Lef1 and nuclear β-catenin restricted to non-epithelial Ecad-/GLI2A+ tumor cells (asterisks). G. Immunostaining for Lef1 and the EMT marker Snail1 in larger regions of EMT revealed coexpression in cells at the periphery (arrowheads) adjacent to GLI2A+ epithelial tumor cells (dashed line). Snail1 expression was also detected more centrally in mesenchymal GLI2A+ tumor cells that no longer expressed detectable levels of Lef1 (white double asterisks). Scale bars: 50 μm.
Figure 4
Figure 4. Inflammation and signaling alterations in GLI2A-driven gastric adenocarcinomas
A. Increased number of inflammatory cells in GLI2A-expressing gastric tumors detected by immunostaining for CD45 (total myeloid cells), CD3 (T cells), F4/80 (macrophages), and myeloperoxidase (MPO; neutrophils). F4/80 and MPO immunostaining were done in adjacent sections relative to GLI2A immunostaining. B. Upregulation of Hh target genes (Gli1,Ptch1) and transcripts encoding multiple pro-inflammatory cytokines was assessed by qRT-PCR in RNA isolated from control mice (N = 8) and iLgr5;GLI2A gastric tumors (N = 8). Data are expressed as means +/− SEM (***P = 0.0002). C. Immunoblotting using lysates from antral tumors and control antrum shows upregulation of the signaling effector pStat3. D. Negligible levels of pStat3 were detected in control antrum (left panels), whereas in tumors, pStat3 was detected in GLI2A-expressing tumor cells, stromal cells, and GLI2A-negative hyperplastic epithelia (arrow). E. pERK and GLI2A were co-expressed in a variable proportion of cells typically located in the uppermost portion of tumors. F. Phosphorylation/activation of the mTOR target S6 was detected by pS6 immunostaining, which was uniformly elevated in tumor cells and, at lower levels, in hyperplastic, GLI2A-negative gastric epithelia. G. Immunoblot analysis showing upregulation of mTOR signaling in GLI2A tumors, with increased levels of pAkt, pS6K, and pS6. H) Transcripts for Egfr, Her2, and multiple Egfr ligands were measured by qRT-PCR in RNA isolated from control antra (N = 8) and iLgr5;GLI2A gastric tumors (N = 8). Data are expressed as means +/− SEM [****P < 0.0001 (Ereg), **P = 0.0037 (Egfr), and **P = 0.0079 (Areg)]. Scale bars: 50 μm.
Figure 5
Figure 5. Induction of proliferation and S6 phosphorylation are detected at early stages of tumor development
A. Double-immunostaining revealed Ki67+/GLI2A+ cells in the largely quiescent base of gastric antral glands (left panels) at 3 days and 7 days after starting doxy treatment in iLgr5;GLI2A mice. B. Double-immunostaining for pStat3 and GLI2A revealed few GLI2A+ cells co-expressing pStat3 (white arrowheads) in the base of antral glands at 3 days and 7 days after starting doxy treatment in iLgr5;GLI2A mice. C. Temporal activation pattern of transcripts for multiple pro-inflammatory cytokines and Hh target genes (Gli1,Ptch1), measured by qRT-PCR in RNA isolated from controls (N = 5 for each time point) and iLgr5;GLI2A gastric tumors (N = 4 for each time point) at 1, 2, and 3 weeks post doxy-induction. Data are expressed as means +/− SEM (*P = 0.0159). D. Double-immunostaining revealed a strict correlation between expression of GLI2A and pS6 in the base of gastric glands during early stages of tumor development. Scale bars: 20 μm.
Figure 6
Figure 6. mTOR signaling contributes to growth of GLI2A-driven gastric cancers
A. Gross appearance of stomachs from iLgr5;GLI2A mice showing impaired growth of tumors in rapamycin-treated mice when compared to vehicle-treated. B. Decreased antral tumor thickness in rapamycin-treated (N = 8) versus vehicle-treated (N = 6) iLgr5;GLI2A mice. Data are expressed as means +/− SEM (***P = 0.0007). C. Markedly reduced mass of GLI2A-expressing tumor cells as well as GLI2A-negative hyperplastic epithelia in rapamycin-treated iLgr5;GLI2A mice. Insets in right panels show appearance of cells with abundant pale-staining cytoplasm reminiscent of mucin, seen only in tumors from rapamycin-treated mice. D. PAS-Alcian blue staining detects cells containing abundant mucin only in tumor cells from rapamycin-treated mice. E. Immunostaining for the mTOR pathway reporter pS6 is lost in GLI2A-expressing tumor cells as well as hyperplastic gastric epithelia of rapamycin-treated mice, confirming effective blockade of mTOR signaling. F. Immunoblot analysis of tumor lysates from rapamycin-treated mice corroborates pS6 immunostaining results in E), showing nearly complete inhibition of pS6 expression relative to tumors from vehicle-treated mice. In contrast, treatment with rapamycin had minimal effects on pAkt or pStat3 expression. G. Immunostaining for Ki67 and GLI2A in tumors from rapamycin-treated mice revealed a striking reduction in the proliferative compartment of GLI2A-negative epithelial cells, particularly at 11 days post-induction (vertical arrows in left panels). H. In contrast to the undifferentiated vehicle-treated tumors in iLgr5;GLI2A mice, tumor cells from rapamycin-treated mice expressed Muc5ac and GSII-binding mucins. I. Some tumor cells from rapamycin-treated mice aberrantly expressed Muc5ac and bound GSII lectin in the same cell. Scale bars: 100 μm.

Similar articles

Cited by

References

    1. Ferlay J, Soerjomataram I, Ervik M, Dikshit R, Ester S, Mathers C, Rebelo M, Parkin DM, Forman D, Bray F. GLOBOCAN 2012 v1.0, Cancer Incidence and Mortality Worldwide: IARC CancerBase No. 11. 2013. Lyon, France: International Agency for Research on Cancer;
    1. Piazuelo MB, Epplein M, Correa P. Gastric cancer: an infectious disease. Infect Dis Clin North Am. 2010;24:853–69. vii. - PMC - PubMed
    1. Siegel R, Ma J, Zou Z, Jemal A. Cancer statistics, 2014. CA Cancer J Clin. 2014;64:9–29. - PubMed
    1. Wang K, Yuen ST, Xu J, Lee SP, Yan HH, Shi ST, Siu HC, Deng S, Chu KM, Law S, Chan KH, Chan AS, Tsui WY, et al. Whole-genome sequencing and comprehensive molecular profiling identify new driver mutations in gastric cancer. Nat Genet. 2014;46:573–82. - PubMed
    1. Liu J, McCleland M, Stawiski EW, Gnad F, Mayba O, Haverty PM, Durinck S, Chen YJ, Klijn C, Jhunjhunwala S, Lawrence M, Liu H, Wan Y, et al. Integrated exome and transcriptome sequencing reveals ZAK isoform usage in gastric cancer. Nat Commun. 2014;5:3830. - PMC - PubMed

Publication types

MeSH terms