. 2016 Feb 9;11(2):e0148998.
doi: 10.1371/journal.pone.0148998. eCollection 2016.

Heat Shock Protein 27 Plays a Pivotal Role in Myofibroblast Differentiation and in the Development of Bleomycin-Induced Pulmonary Fibrosis

Affiliations

Heat Shock Protein 27 Plays a Pivotal Role in Myofibroblast Differentiation and in the Development of Bleomycin-Induced Pulmonary Fibrosis

Ah-Mee Park et al. PLoS One. .

Abstract

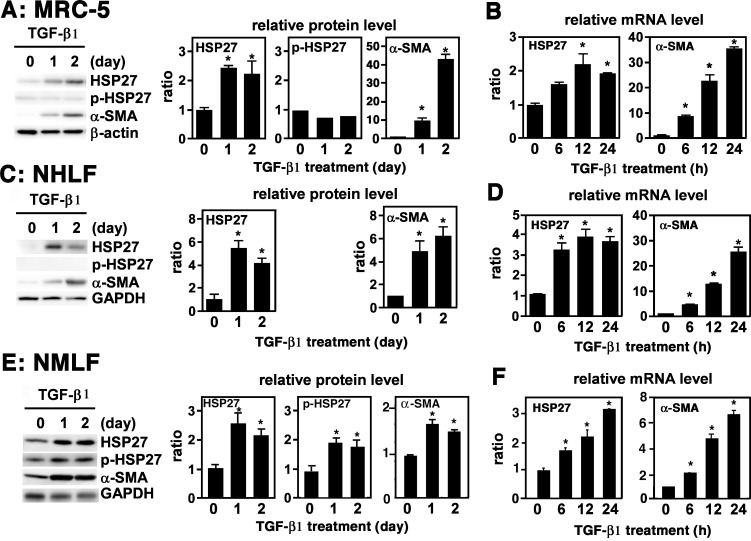
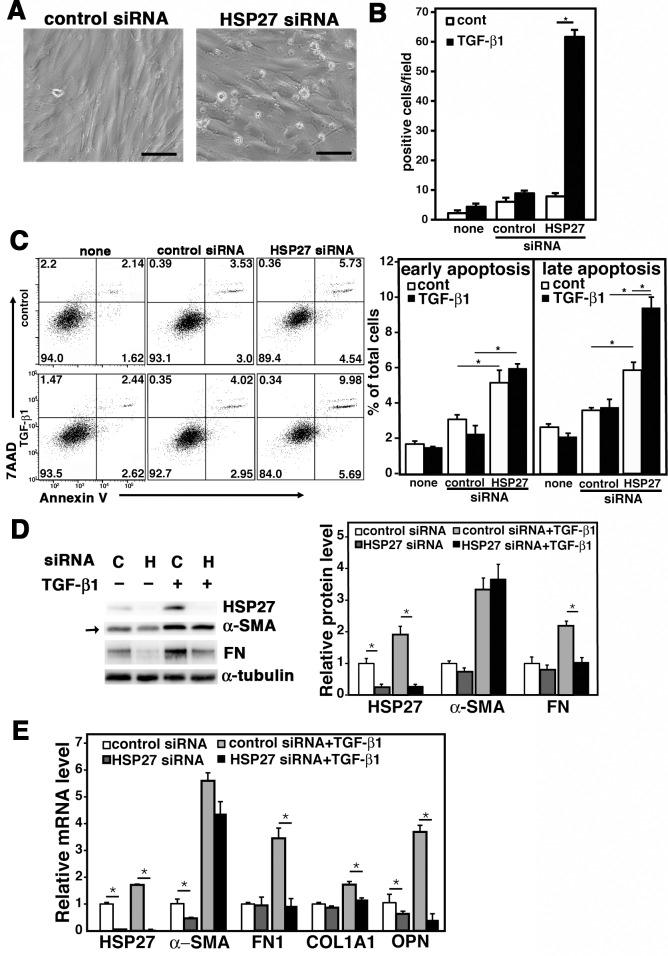
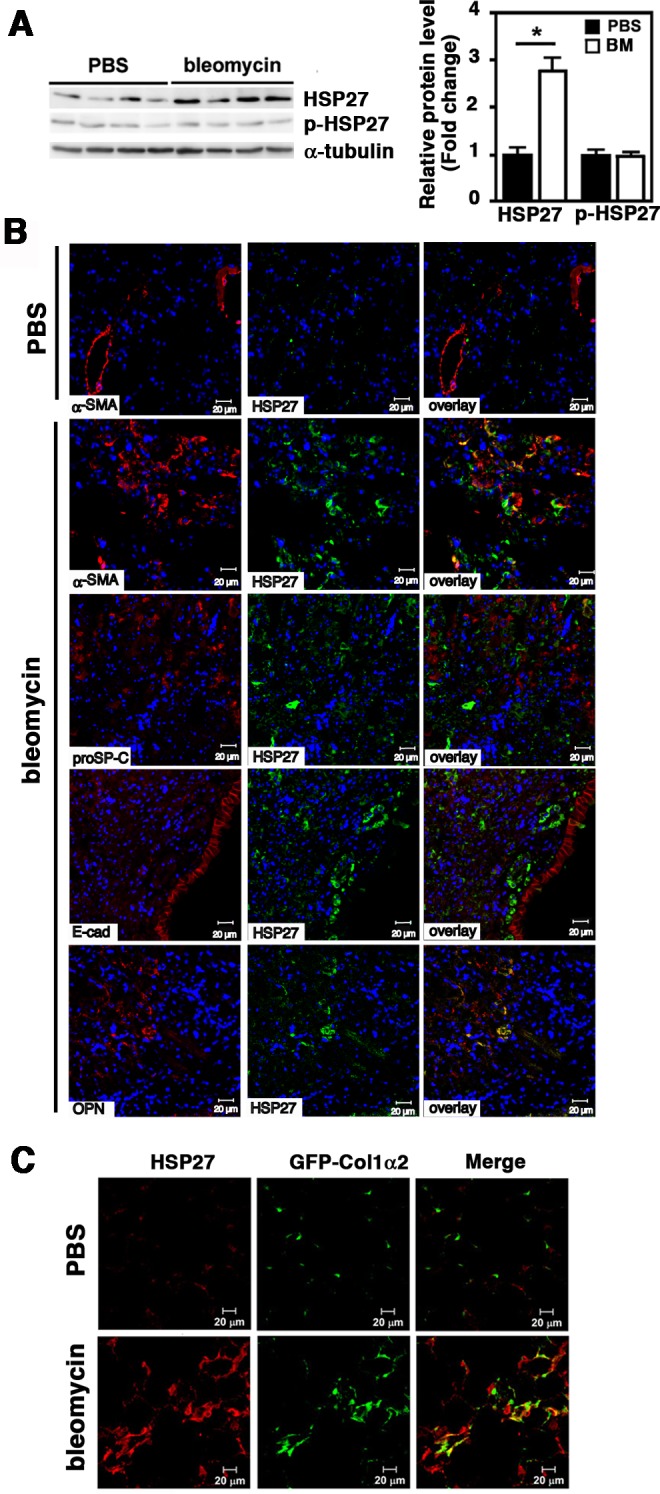
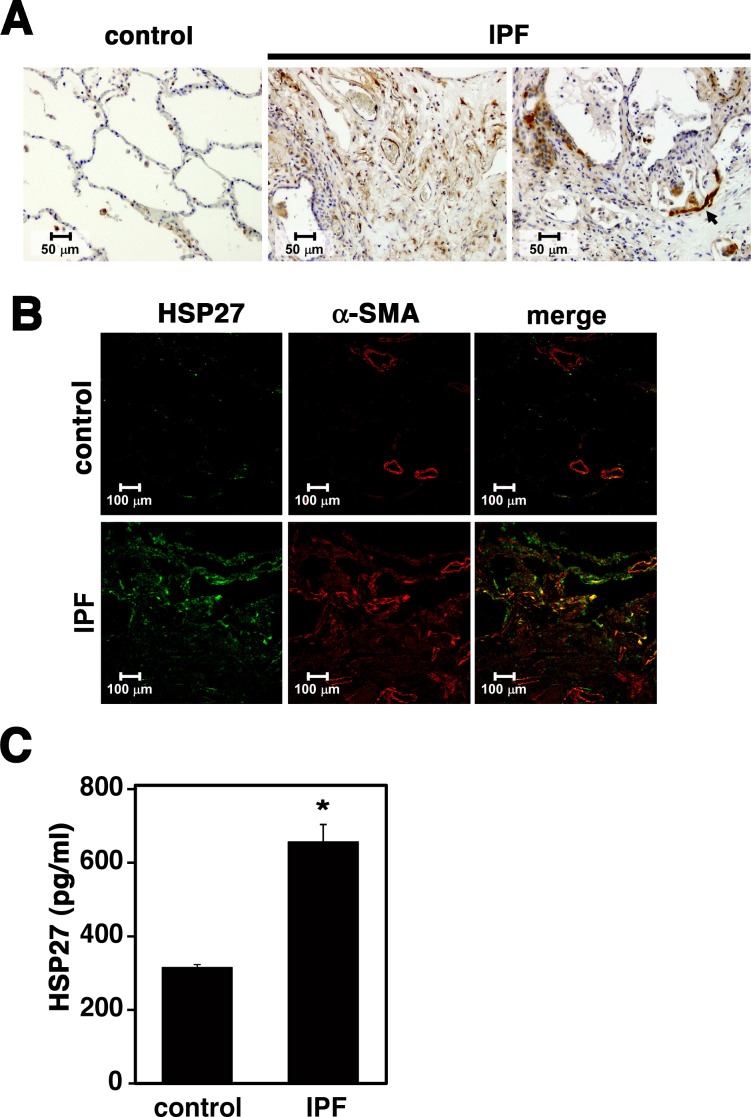
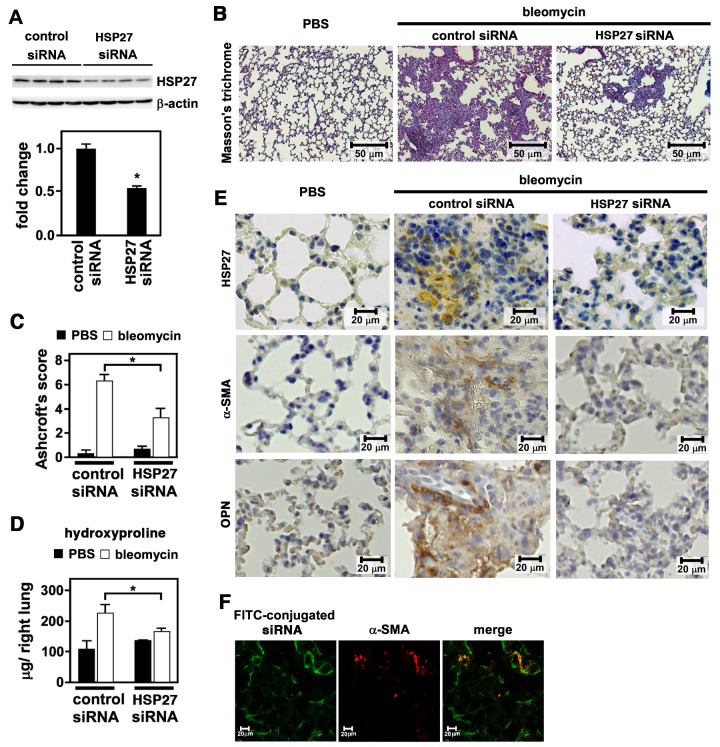
Heat shock protein 27 (HSP27) is a member of the small molecular weight HSP family. Upon treatment with transforming growth factor β1 (TGF-β1), we observed upregulation of HSP27 along with that of α-smooth muscle actin (α-SMA), a marker of myofibroblast differentiation, in cultured human and mouse lung fibroblasts. Furthermore, by using siRNA knockdown, we demonstrated that HSP27 was involved in cell survival and upregulation of fibronectin, osteopontin (OPN) and type 1 collagen, all functional markers of myofibroblast differentiation, in TGF-β1-treated MRC-5 cells. In lung tissues of bleomycin-treated mice, HSP27 was strongly upregulated and substantially co-localized with α-SMA, OPN and type I collagen but not with proSP-C (a marker of type II alveolar epithelial cells), E-cadherin (a marker of epithelial cells) or F4/80 (a marker of macrophages). A similar co-localization of HSP27 and α-SMA was observed in lung tissues of patients with idiopathic pulmonary fibrosis. Furthermore, airway delivery of HSP27 siRNA effectively suppressed bleomycin-induced pulmonary fibrosis in mice. Collectively, our findings indicate that HSP27 is critically involved in myofibroblast differentiation of lung fibroblasts and may be a promising therapeutic target for lung fibrotic diseases.


Conflict of interest statement

Competing Interests: The authors have declared that no competing interests exist.

Figures

Fig 1
Fig 1. Upregulation of HSP27 in TGF-β1-treated lung fibroblasts.
(A, B) MRC-5. Cells in monolayer were washed twice with PBS to remove FBS, cultured in Opti-MEM for 24 h, and mock-treated or treated with 1 ng/ml of TGF-β1 for the indicated lengths of time. (A) Immunoblot analysis. Protein levels of HSP27, p-HSP27, and α-SMA were determined by immunoblot analysis. For a loading control, β-actin was used. Signal intensities were quantified using Image J software and normalized by β-actin. A representative image from four independent experiments is shown in the left. Quantitative data are shown as mean ± SE (n = 4) in the right. *: P<0.05 by one-way ANOVA. (B) Quantitative PCR. Expression levels of HSP27 and α-SMA mRNAs were determined by quantitative PCR and normalized by GAPDH. Data are shown as mean ± SE (n = 4). *: P<0.05 by one-way ANOVA. (C, D) NHLF. Cells in monolayer were washed twice with PBS, cultured in Opti-MEM for 24 h, and mock-treated or treated with 2 ng/ml of TGF-β1 for indicated length of time. (C) Immunoblot analysis. This was performed as described above. For a loading control, GAPDH was used. A representative image from four independent experiments is shown in the left. Quantitative data are shown as mean ± SE (n = 4) in the right. *: P<0.05 by one-way ANOVA. (D) Quantitative PCR. This was performed as described above. Data are shown as mean ± SE (n = 4). *: P<0.05 by one-way ANOVA. (E, F) NMLF. Cells in monolayer were washed twice with PBS, cultured in Opti-MEM containing 1% FBS for 24 h, and mock-treated or treated with 4 ng/ml of TGF-β1 for the indicated length of time. (E) Immunoblot analysis. This was performed as described above. For a loading control, GAPDH was used. A representative image from six independent experiments is shown in the left. Quantitative data are shown as mean ± SE (n = 6) in the right. *: P<0.05 by one-way ANOVA. (F) Quantitative PCR. This was performed as described above. Data are shown as mean ± SE (n = 6). *: P<0.05 by one-way ANOVA.
Fig 2
Fig 2. Effect of HSP27 siRNA on TGF-β1-treated MRC-5.
MRC-5 cells were transfected with control or HSP27 siRNA and cultured for 24 h. After washing to remove FBS, cells were placed in Opti-MEM and treated with 0.5 ng/ml of TGF-β1 for 48 h. (A) Phase contrast microscopic images. Representative results from three independent experiments are shown. The bars indicate 100 μm. (B) Cell viability assay. Dead cells were detected by staining in situ with 5 μg/ml of propidium iotide (PI). PI-positive cells in each field (44 mm2) were counted on a fluorescence microscope. Data are shown as mean ± SE (n = 6). *: P<0.05 by Student’s t-test. (C) Apoptosis assay. Apoptotic cells were detected by flow cytometry using the Annexin V and 7AAD double staining assay. The FACS plots are shown in the left with % of cells in the four gated areas. Columns in the right show % of cells in early apoptosis (Annexin V+ and 7AAD) and late apoptotosis (Annexin V+ and 7AAD+) as mean ± SE (n = 3). *: P<0.05 by Student’s t-test. (D) Immunoblot assay. MRC-5 cells were transfected with control siRNA “C” or HSP27 siRNA “H” and cultured for 24 h. Then, after changing the culture medium to Opti-MEM containing 2% FBS, cells were treated with or without 0.5 ng/ml of TGF-β1 for 48 h. Protein levels of HSP27, α-SMA and fibronectin (FN) were determined by immunoblot analysis. For a loading control, α-tubulin was used. Quantitative data are shown as mean ± SE (n = 4) in the right. *: P<0.05 by Student’s t-test. (E) Quantitative PCR. MRC-5 cells were transfected with control or HSP27 siRNA and cultured for 24 h. Then, after changing the culture medium to Opti-MEM containing 2% FBS, cells were treated with or without 0.5 ng/ml of TGF-β1 for 24 h. Expression levels of HSP27, α-SMA, FN1, α1 type I collagen (COL1A1) and opsteopontin (OPN) mRNAs were determined by quantitative PCR and normalized by GAPDH. Data are shown as mean ± SE (n = 6). *: P<0.05 by Student’s t-test.
Fig 3
Fig 3. Upregulation of HSP27 in lung tissues of bleomycin-treated mice.
Mice were intratracheally treated with PBS or bleomycin. After 14 days, mice were sacrificed and lungs were removed. (A) Immunoblot analysis. Protein levels of HSP27 and p-HSP27 were analyzed by Immunoblotting using tissue lysates prepared from right lungs. For a loading control, α-tubulin was used. Signal intensities were quantified using Image J software. A representative image from seven independent experiments is shown in the left. Quantitative data are shown as mean ± SE (n = 7) in the right. *: P<0.05 by Student’s t-test. (B) Immunofluorescence staining. Left lungs were fixed with 10% formaldehyde and embedded in paraffin. Tissue sections (4 μm) were double stained for HSP27 (green) and α-SMA (red), proSP-C (red), E-cadherin (E-cad, red) or OPN (red) as depicted. For nuclear staining, TO-PRO-3 (blue) was used. The bars indicate 20 μm. Representative images from three independent experiments are shown. (C) Col1a2-EGFP reporter mice. Mice were intratracheally instilled with PBS or bleomycin. After 14 days, mice were sacrificed and lungs were fixed with 4% paraformaldehyde, treated with 30% sucrose for cryoprotection, and embedded. Frozen sections (6 μm thick) were stained for HSP27 (red). Collagen Type I α2 was visualized by EGFP (green). The bars indicate 20 μm. Representative images from three independent experiments are shown.
Fig 4
Fig 4. Strong upregulation of HSP27 in lung tissues from IPF patients.
(A) Immunohistochemical staining of HSP27 in human lung tissues. Representative images are shown (n = 5). (B) Double immunofluorescence staining of HSP27 (green) and α-SMA (red) in human lung tissues. Representative images are shown (n = 4). (C) Quantitation of HSP27 in bronchoalveolar lavage (BAL) samples. HSP27 contents in BAL samples containing 0.5% Triton X-100 were determined by ELISA. Data are shown as mean ± SE (control, n = 3; IPF, n = 6). *: P<0.05 by Student’s t-test.
Fig 5
Fig 5. Effect of HSP27 siRNA on bleomycin-induced pulmonary fibrosis in mice.
Mice were intratracheally treated with PBS or bleomycin. On day 4, 6, 9, and 12, mice were intranasally inoculated with 5 μg of control siRNA or HSP27 siRNA using MaxSuppressor In Vivo RNA-LANCEr II. On day 14, mice were sacrificed and lungs were removed. (A) Immunoblot analysis. Protein levels of HSP27 were analyzed by immunoblotting using tissue lysates prepared from right lungs. As a loading control, β-actin was used. A representative image from six independent experiments is shown (above). Quantitative data are shown as mean ± SE (n = 6) (below). *: P<0.05 by Student’s t-test. (B) Masson’s trichrome staining. This was performed using tissue sections from left lungs. Representative images from three independent experiments are shown. The bars indicate 50 μm. (C) Ashcroft’s Score. Fibrosis levels were quantified by Ashcroft’s Score. Data are shown as mean ± SE (n = 7). *: P<0.05 by Student’s t-test. (D) Hydroxyproline content. Tissue homogenates prepared from right lungs were used to determined hydroxproline contents. Data are shown as mean ± SE (n = 7). *: P<0.05 by Student’s t-test. (E) Immunohistochemical staining. Tissue sections from left lungs were immunohistochemically stained for HSP27, α-SMA, and OPN. Representative images from three independent experiments are shown. The bars indicate 20 μm. (F) Airway delivery of FITC-labeled siRNA. Mice were intratracheally treated with bleomycin. On day 4, mice were intranasally inoculated with 5 μg of FITC-labeled siRNA mixed in MaxSuppressor In Vivo RNA-LANCEr II. After 1 h, lungs were removed and frozen sections were made. Tissue sections were fixed and stained for α-SMA. FITC (green) and α-SMA (red) were observed on a fluorescence microscopy. Representative images from four independent experiments are shown.

Similar articles

Cited by

References

    1. Wight TN, Potter-Perigo S. The extracellular matrix: an active or passive player in fibrosis? Am J Physiol Gastrointest Liver Physiol. 2011; 301(6):G950–955. 10.1152/ajpgi.00132.2011 . - DOI - PMC - PubMed
    1. Selman M, King TE, Pardo A. Idiopathic pulmonary fibrosis: prevailing and evolving hypotheses about its pathogenesis and implications for therapy. Ann Intern Med. 2001; 134(2):136–151. . - PubMed
    1. Wynn TA. Cellular and molecular mechanisms of fibrosis. J Pathol. 2008; 214(2):199–210. 10.1002/path.2277 . - DOI - PMC - PubMed
    1. Honda E, Park AM, Yoshida K, Tabuchi M, Munakata H. Myofibroblasts: Biochemical and proteomic approaches to fibrosis. Tohoku J Exp Med. 2013; 230(2):67–73. . - PubMed
    1. Willis BC, Borok Z. TGF-β-induced EMT: mechanisms and implications for fibrotic lung disease. Am J Physiol Lung Cell Mol Physiol. 2007; 293(3):L525–534. 10.1152/ajplung.00163.2007 . - DOI - PubMed

Publication types

MeSH terms