

Lower Neighborhood Socioeconomic Status Associated with Reduced Diversity of the Colonic Microbiota in Healthy Adults
- PMID: 26859894
- PMCID: PMC4747579
- DOI: 10.1371/journal.pone.0148952
Lower Neighborhood Socioeconomic Status Associated with Reduced Diversity of the Colonic Microbiota in Healthy Adults
Abstract
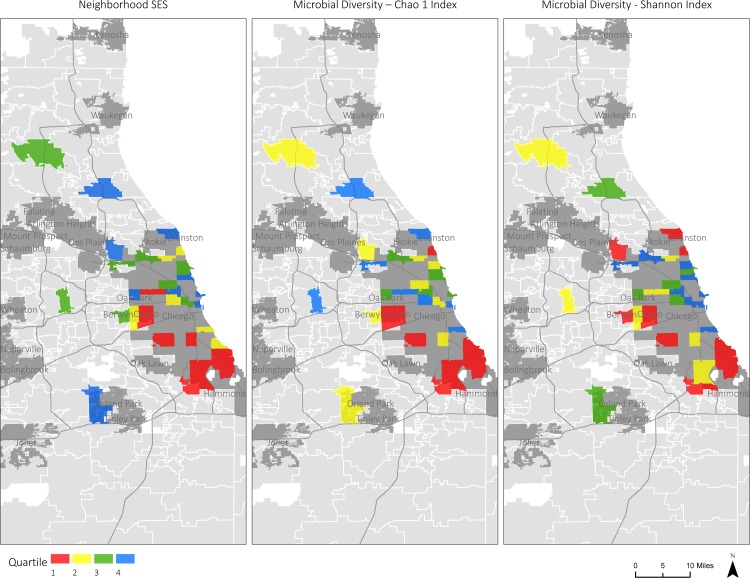
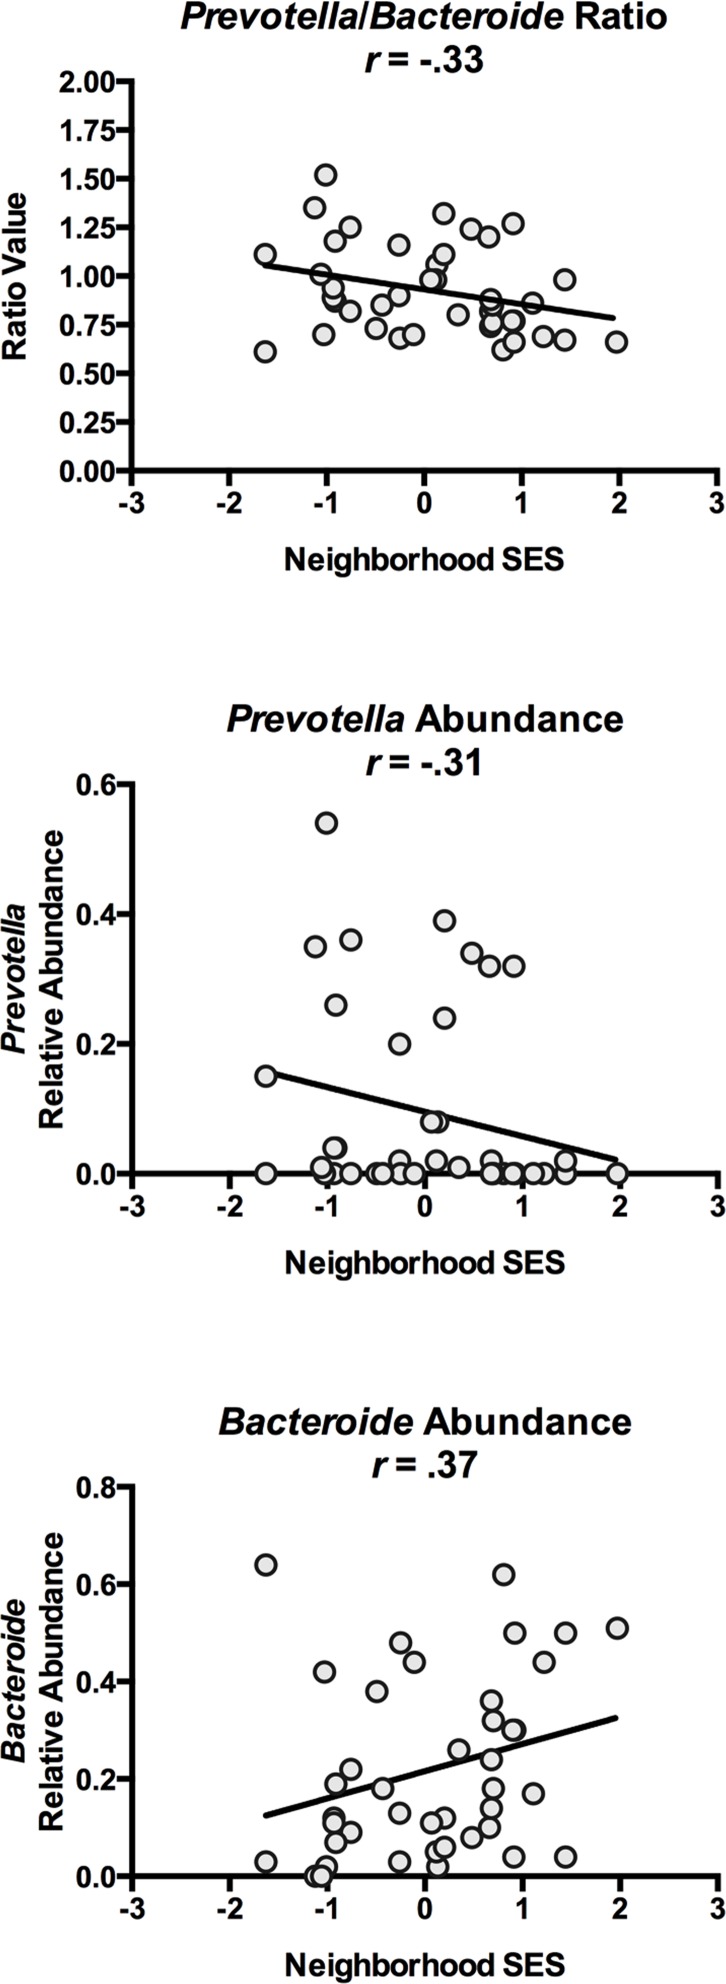
In the United States, there are persistent and widening socioeconomic gaps in morbidity and mortality from chronic diseases. Although most disparities research focuses on person-level socioeconomic-status, mounting evidence suggest that chronic diseases also pattern by the demographic characteristics of neighborhoods. Yet the biological mechanisms underlying these associations are poorly understood. There is increasing recognition that chronic diseases share common pathogenic features, some of which involve alterations in the composition, diversity, and functioning of the gut microbiota. This study examined whether socioeconomic-status was associated with alpha-diversity of the colonic microbiota. Forty-four healthy adults underwent un-prepped sigmoidoscopy, during which mucosal biopsies and fecal samples were collected. Subjects' zip codes were geocoded, and census data was used to form a composite indicator of neighborhood socioeconomic-status, reflecting household income, educational attainment, employment status, and home value. In unadjusted analyses, neighborhood socioeconomic-status explained 12-18 percent of the variability in alpha-diversity of colonic microbiota. The direction of these associations was positive, meaning that as neighborhood socioeconomic-status increased, so did alpha-diversity of both the colonic sigmoid mucosa and fecal microbiota. The strength of these associations persisted when models were expanded to include covariates reflecting potential demographic (age, gender, race/ethnicity) and lifestyle (adiposity, alcohol use, smoking) confounds. In these models neighborhood socioeconomic-status continued to explain 11-22 percent of the variability in diversity indicators. Further analyses suggested these patterns reflected socioeconomic variations in evenness, but not richness, of microbial communities residing in the sigmoid. We also found indications that residence in neighborhoods of higher socioeconomic-status was associated with a greater abundance of Bacteroides and a lower abundance of Prevotella, suggesting that diet potentially underlies differences in microbiota composition. These findings suggest the presence of socioeconomic variations in colonic microbiota diversity. Future research should explore whether these variations contribute to disparities in chronic disease outcomes.
Conflict of interest statement
Figures

References
-
- World HO (2008) The global burden of disease: 2004 update Geneva, Switzerland: World Health Organization.
-
- Adler NE, Rehkopf DH (2008) U.S. disparities in health: descriptions, causes, and mechanisms. Annu Rev Public Health 29: 235–252. - PubMed
-
- Lynch J, Smith GD (2005) A life course approach to chronic disease epidemiology. Annu Rev Public Health 26: 1–35. - PubMed
Publication types
MeSH terms
Substances
Grants and funding
LinkOut - more resources
Full Text Sources
Other Literature Sources
