. 2016 Aug;24(9):1344-51.
doi: 10.1038/ejhg.2016.8. Epub 2016 Feb 10.

A method for analyzing multiple continuous phenotypes in rare variant association studies allowing for flexible correlations in variant effects

Affiliations

A method for analyzing multiple continuous phenotypes in rare variant association studies allowing for flexible correlations in variant effects

Jianping Sun et al. Eur J Hum Genet. 2016 Aug.

Abstract

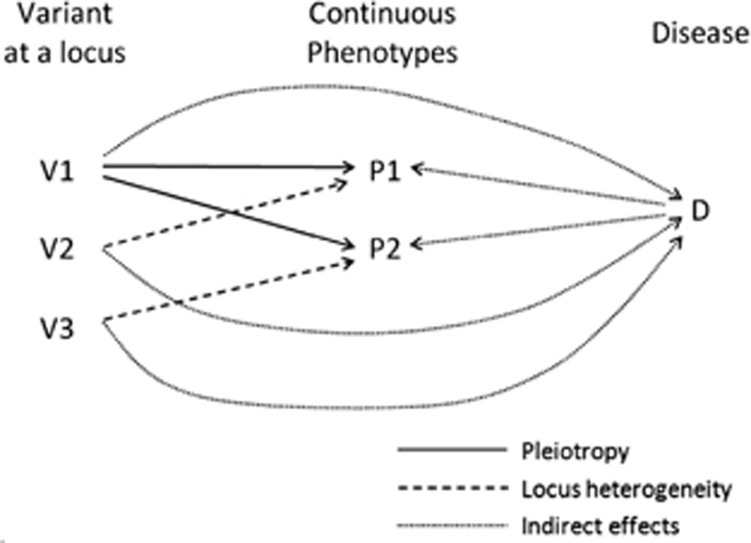
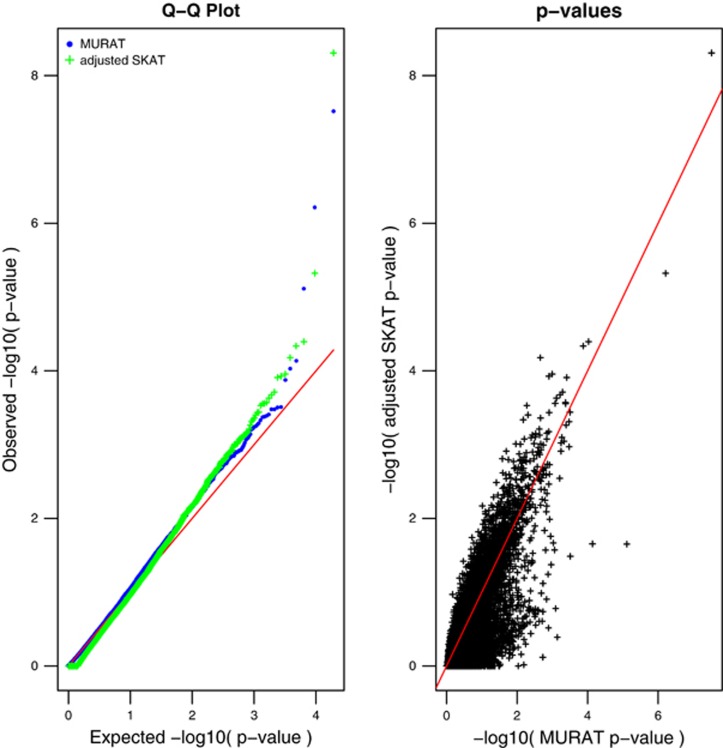
For region-based sequencing data, power to detect genetic associations can be improved through analysis of multiple related phenotypes. With this motivation, we propose a novel test to detect association simultaneously between a set of rare variants, such as those obtained by sequencing in a small genomic region, and multiple continuous phenotypes. We allow arbitrary correlations among the phenotypes and build on a linear mixed model by assuming the effects of the variants follow a multivariate normal distribution with a zero mean and a specific covariance matrix structure. In order to account for the unknown correlation parameter in the covariance matrix of the variant effects, a data-adaptive variance component test based on score-type statistics is derived. As our approach can calculate the P-value analytically, the proposed test procedure is computationally efficient. Broad simulations and an application to the UK10K project show that our proposed multivariate test is generally more powerful than univariate tests, especially when there are pleiotropic effects or highly correlated phenotypes.


Figures

Figure 1
Figure 1
Possible patterns of genetic architecture that could link variants at a locus to a set of continuous phenotypes. The solid line represents pleiotropy, where a single variant influences multiple phenotypes. The dashed line describes the locus heterogeneity, where different variants in the same gene or region each influence a different phenotype. The dotted line represents a situation where correlation among phenotypes arises indirectly due to the variants' effects on disease; the phenotypes could be symptoms, endophenotypes, or continuous manifestations of disease.
Figure 2
Figure 2
Power comparisons among MURAT, SKAT, and Maity's method under power simulation scenario 1. The top and middle panels show empirical powers of MURAT, which tests associations with two phenotypes simultaneously, versus SKAT, which tests associations with the two phenotypes separately, when two causal variants are associated with both traits. The bottom panel shows empirical powers of MURAT, Maity's test with a linear kernel, and SKAT, when five causal variants are associated with multiple traits. The significance level is 0.05 for all tests and the univariate tests, SKAT, are corrected for multiple comparisons.
Figure 3
Figure 3
Empirical powers of MURAT versus SKAT for trait 1 at significance level of 0.05. Causal variants are associated with only the first trait. The results for SKAT on trait 1 are not adjusted for multiple testing.
Figure 4
Figure 4
The left panel shows the Q–Q plot for MURAT P-values and adjusted SKAT P-values on 19 123 genes in UK10K data analysis. The slopes for the MURAT Q–Q plot and adjusted SKAT Q–Q plot are 1.04 and 1.02, respectively. The right panel shows the comparison of −log10(P-values) between MURAT and SKAT tests on each of the 19 123 genes. The SKAT results are corrected for multiple comparisons and the adjusted P-values are defined as twice the minimum of the LS- and FN-based P-values obtained via SKAT.

References

    1. Li B, Leal SM: Methods for detecting associations with rare variants for common diseases: application to analysis of sequence data. Am J Hum Genet 2008; 83: 311–321. - PMC - PubMed
    1. Madsen BE, Browning SR: A groupwise association test for rare mutations using a weighted sum statistic. PLoS Genet 2009; 5: e1000384. - PMC - PubMed
    1. Wu MC, Lee S, Cai T, Li Y, Boehnke M, Lin X: Rare variant association testing for sequencing data with the sequence kernel association test. Am J Hum Genet 2011; 89: 82–93. - PMC - PubMed
    1. Lee S, Wu MC, Lin X: Optimal tests for rare variant effects in sequencing association studies. Biostatistics 2012; 13: 762–775. - PMC - PubMed
    1. Sun J, Zheng Y, Hsu L: A unified mixed-effects model for rare-variant association in sequencing studies. Genet Epidemiol 2013; 37: 334–344. - PMC - PubMed

Publication types