. 2016 Apr;116(4):395-408.
doi: 10.1038/hdy.2015.113. Epub 2016 Feb 10.

Genome-wide prediction models that incorporate de novo GWAS are a powerful new tool for tropical rice improvement

Affiliations

Genome-wide prediction models that incorporate de novo GWAS are a powerful new tool for tropical rice improvement

J E Spindel et al. Heredity (Edinb). 2016 Apr.

Abstract

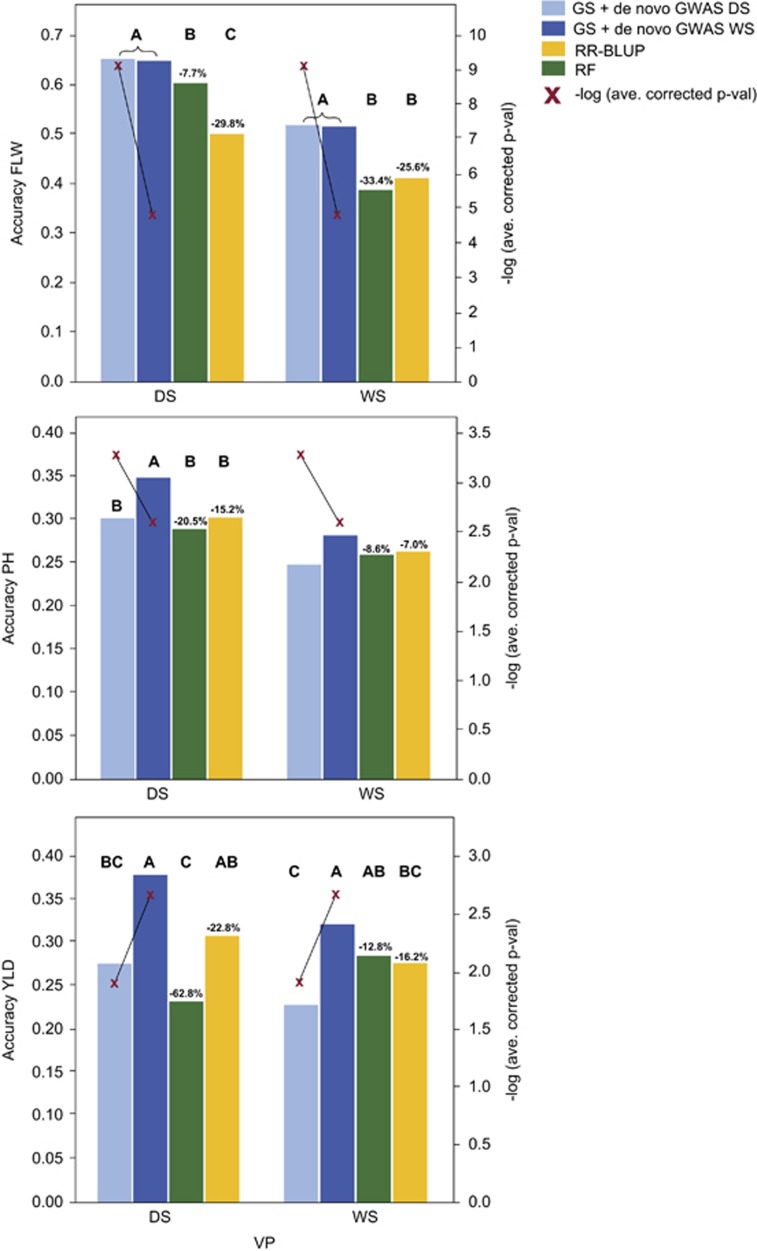
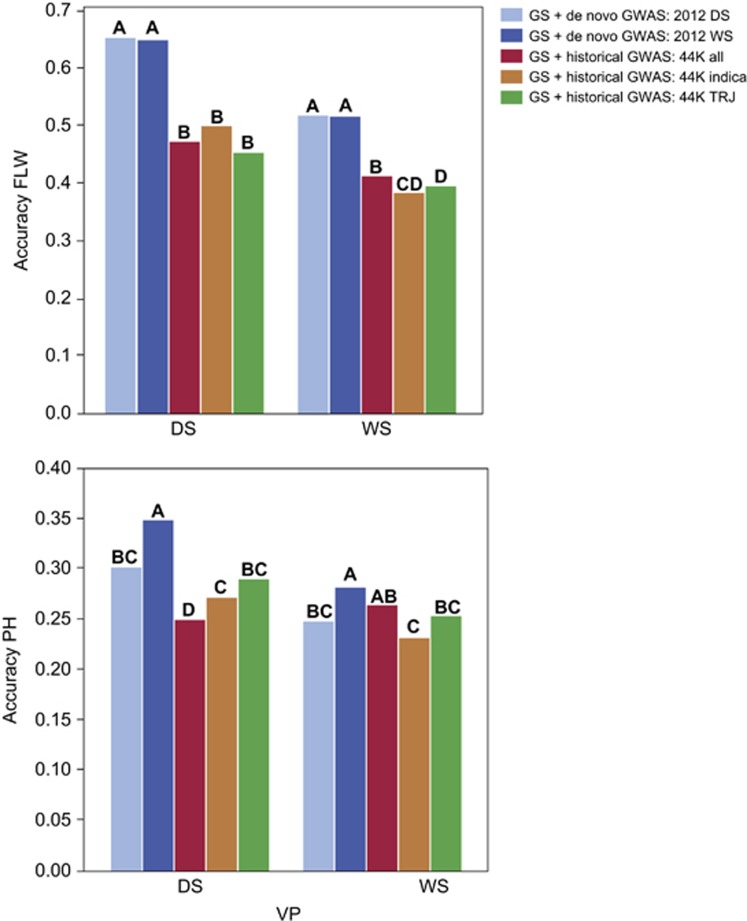
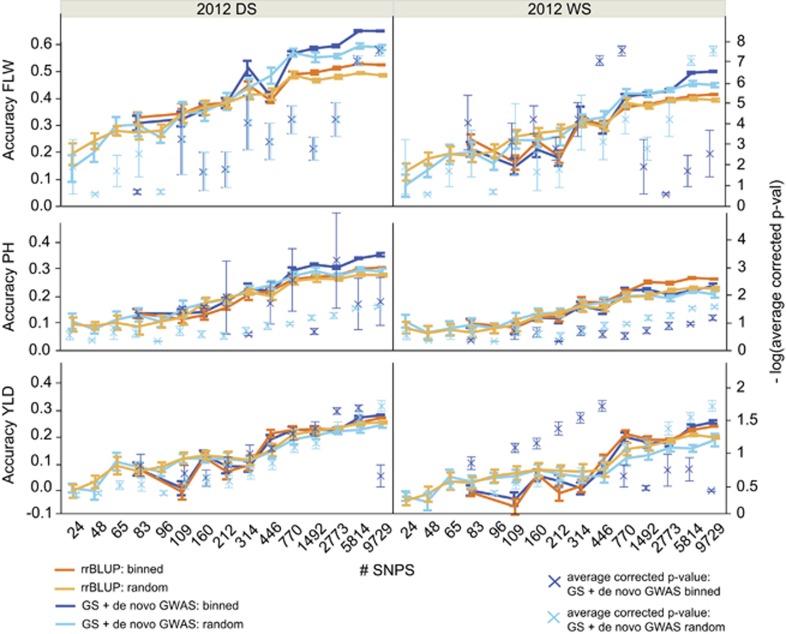
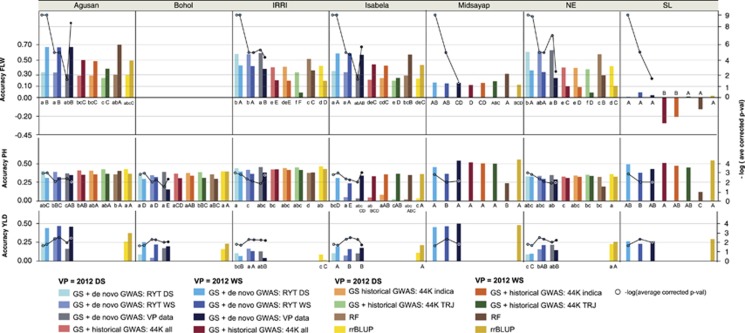
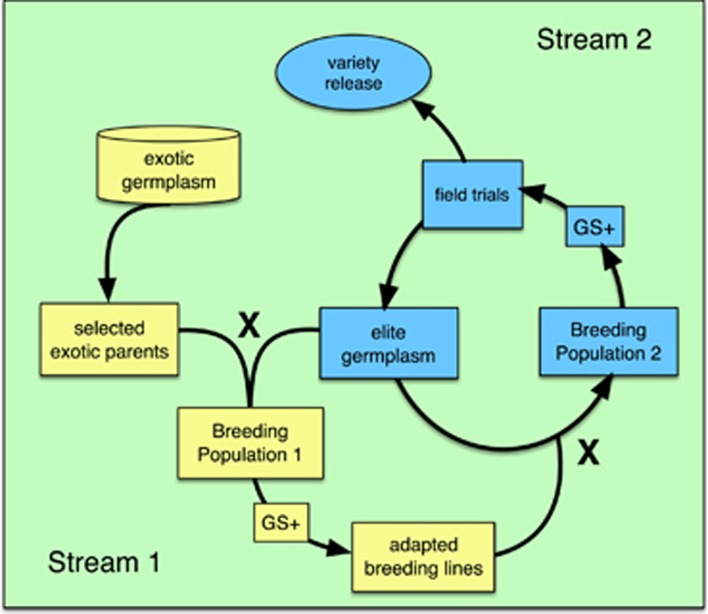
To address the multiple challenges to food security posed by global climate change, population growth and rising incomes, plant breeders are developing new crop varieties that can enhance both agricultural productivity and environmental sustainability. Current breeding practices, however, are unable to keep pace with demand. Genomic selection (GS) is a new technique that helps accelerate the rate of genetic gain in breeding by using whole-genome data to predict the breeding value of offspring. Here, we describe a new GS model that combines RR-BLUP with markers fit as fixed effects selected from the results of a genome-wide-association study (GWAS) on the RR-BLUP training data. We term this model GS + de novo GWAS. In a breeding population of tropical rice, GS + de novo GWAS outperformed six other models for a variety of traits and in multiple environments. On the basis of these results, we propose an extended, two-part breeding design that can be used to efficiently integrate novel variation into elite breeding populations, thus expanding genetic diversity and enhancing the potential for sustainable productivity gains.


Figures

Figure 1
Figure 1
Cross-validation prediction accuracies of flowering time (FLW, top), plant height (PH, middle) and grain yield (YLD, bottom) in the RYT data set, comparing GS + de novo GWAS models (blue) to RR-BLUP (yellow) and random forest (RF) (green) models, left axis. Plots show the results using the optimized training population for prediction of each trait in the RYT 2012 dry season (DS) and RYT 2012 wet seasons (WS) (that is, the cross-validation experiment that resulted in the best prediction accuracy for each trait in each validation season, see Supplementary Table S2A). GWAS for the GS + de novo GWAS models were run using both the RYT 2012 DS data (light blue) and the RYT 2012 WS data (dark blue). Percent decrease in accuracy of RR-BLUP and RF models versus the average of the two GS + de novo GWAS models (FLW), or the GS + de novo GWAS WS model are shown over the RR-BLUP and RF bars, respectively. Bars not labeled with the same letter (Pairwise Student's t-test) indicate a significant difference in accuracy of the statistical methods across all experiments. Red X's mapped to the right axis=−log * average P-value (using the Wald test) of the SNPs fit as fixed effects in the GS + de novo GWAS models, after FDR multiple-test correction.
Figure 2
Figure 2
Comparison of GS + de novo GWAS with GS + historical GWAS models for flowering time (FLW, top), and plant height (PH, bottom). Graphs shows the results using the optimized training population for prediction of each trait in the RYT 2012 dry season (DS) and RYT 2012 wet seasons (WS; that is, the cross-validation experiment that resulted in the best prediction accuracy for each trait in each validation season; see Supplementary Table S2A). GS + GWAS models differed in the GWAS data used to select the SNPs fit as fixed effects. GS + de novo GWAS: 2012 DS (light blue)=de novo GWAS using 2012 DS data on training population individuals, GS + de novo GWAS: 2012 WS (dark blue) =de novo GWAS run using 2012 WS data on training population individuals, GS + historical GWAS: 44K all (red)=previously published (historical) GWAS data were used from Zhao et al., 2011 the 'all subpopulations' results, GS + historical GWAS: 44K indica (burnt orange)= the indica subpopulation results from Zhao et al. 2011 were used, GS + historical GWAS: 44K TRJ (green)=the tropical japonica results from Zhao et al. (2011) were used. Bars not labeled with the same letter indicate a significant difference in model accuracies across all experiments.
Figure 3
Figure 3
Mean accuracies of cross-validation for prediction of flowering time (FLW, top), plant height (PH, middle) and grain yield (YLD, bottom) in the 2012 dry season (left), and the 2012 wet season (right), using 10 selections of SNP subsets chosen to be either distributed evenly throughout the genome (light shades) or chosen at random (dark shades); left axis. The best performing GS + de novo GWAS models (blues), as well as RR-BLUP models (oranges) and previous best performing CV experiments were run for each trait, see Supplementary Table S2A. Right axis (blue X's)=–log * average P-value (Wald test) of the SNPs fit as fixed effects in the GS + de novo GWAS models, after FDR multiple-test correction. All error bars were construed using 1 s.e. of the mean.
Figure 4
Figure 4
Multi-dimensional scaling (MDS) analysis of the distance matrix of the MET adjusted 2012 wet season yield data overlaid on a map of the sites. Triangles=locations of sites, Circles= MDS points, site locations and MDS points have corresponding colors. Values= highest grain yield CV accuracy obtained for that site using the displayed site grouping, bubbles= groupings of sites that produced the highest mean prediction accuracies at those sites. Agusan is clearly an outlier—while it geographically belongs to the southern group and is best predicted by southern group, blue dashed line, it can also improve prediction accuracies of northern group, red dashed line. Squiggle at the top of the plot indicates a break in longitudinal map space.
Figure 5
Figure 5
Cross-validation prediction accuracies of flowering time (FLW, top), plant height (PH, middle), and grain yield (YLD, bottom) using multi-environment (MET) data. Data show the best overall MET accuracies obtained for each trait in each validation season, the 2012 dry season (DS; light shades) and the 2012 wet season (WS; dark shades), and validation site, left axis (Supplementary Table S4A). Accuracies are compared for GS + de novo GWAS models using, as GWAS input, the RYT 2012 DS GWAS results (blue bars), the RYT 2012 WS GWAS results (purple bars), and GWAS run using the validation site and season (gray/black bars) to RR-BLUP results (yellow bars), and for FLW and PH only, the GS + historical GWAS results (red, orange, and green bars for 44K all, 44K indica, and 44K tropical japonica results, respectively), and random forest (RF) results (brown bars). Bars not labeled with the same lower case letter indicate a significant difference in the performance of statistical methods across all experiments where the validation population=2012 DS, bars not labeled with the same capital letter indicate a significant difference in the performance of statistical methods across all experiments where the validation population=2012 WS. Circles mapped to right axis=−log * average P-value (Wald test) of the SNPs fit as fixed effects in the GS + de novo GWAS models, after FDR multiple-test correction.
Figure 6
Figure 6
Diagram of proposed two-stream GS breeding program. Stream 1 (yellow boxes) consists of pre-breeding, in which favorable alleles from exotic germplasm are introduced into adapted germplasm. Exotic parents are crossed with elite germplasm to develop Breeding Population 1. Selection of individuals from Breeding Population 1 is performed using a combination of GS + de novo GWAS models (GS+), in which the exotic QTL are fit as fixed effects, and phenotype. The training population GS would be a subset of breeding population 1, that is, a fraction of breeding population 1 would be both genotyped and phenotyped, while the rest of breeding population 1 would be genotyped only. Adapted materials from Breeding Population 1 are crossed into Breeding Population 2 (Stream 2, blue boxes) where they are further refined using GS + de novo GWAS models, where the fixed effects would include valuable QTL identified based on GWAS performed in Breeding Population 2, the exotic QTL from Stream 1, or any other large effect QTL a breeder might normally target for trait improvement. Output from Stream 2 can be advanced toward variety release or fed back into Stream 1 to serve as parents for further crossing and population development.

References

    1. Alexandrov N, Tai S, Wang W, Mansueto L, Palis K, Fuentes RR et al. (2014). SNP-Seek database of SNPs derived from 3000 rice genomes. Nucleic Acids Res 43 (Database issue): D1023–D1027. - PMC - PubMed
    1. Asoro FG, Newell MA, Beavis WD, Scott MP, Tinker NA, Jannink J-L. (2013). Genomic, marker-assisted, and pedigree-BLUP selection methods for β-glucan concentration in elite oat. Crop Sci 53: 1894–1906.
    1. Begum H, Spindel J, Lalusin AG, Borromeo TH, Gregorio GB, Hernandez JE et al. (2015). Association mapping and genomic selection in rice (Oryza sativa): association mapping for yield and other agronomic traits in elite, tropical rice breeding lines. PLoS One 10: 1371. - PMC - PubMed
    1. Benjamini Y, Hochberg Y. (1995). Controlling the false discovery rate: a practical and powerful approach to multiple testing. J R Statist Soc B 57: 289–300.
    1. Bentley AR, Scutari M, Gosman N, Faure S, Bedford F, Howell P et al. (2014). Applying association mapping and genomic selection to the dissection of key traits in elite European wheat. Theor Appl Genet 127: 2619–2633. - PubMed

Publication types

Substances