

Identification of Conserved and Diverse Metabolic Shifts during Rice Grain Development
- PMID: 26860358
- PMCID: PMC4748235
- DOI: 10.1038/srep20942
Identification of Conserved and Diverse Metabolic Shifts during Rice Grain Development
Abstract
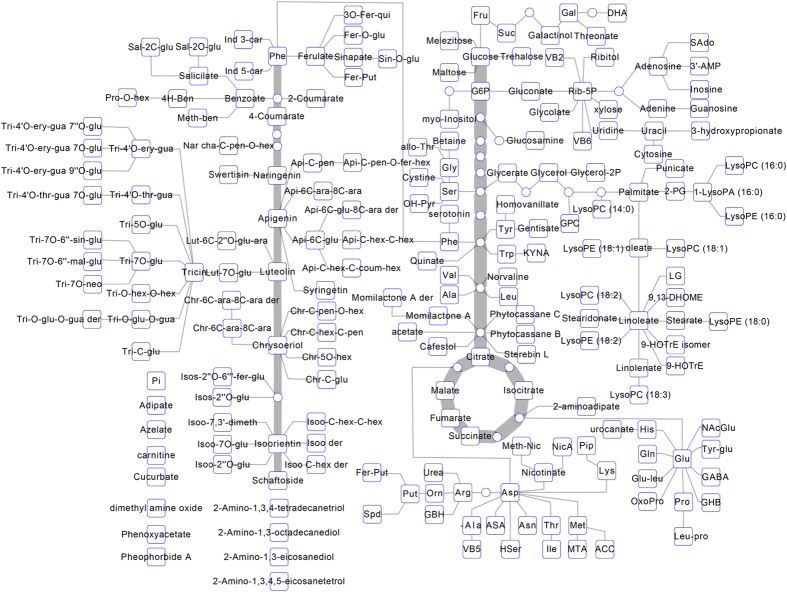
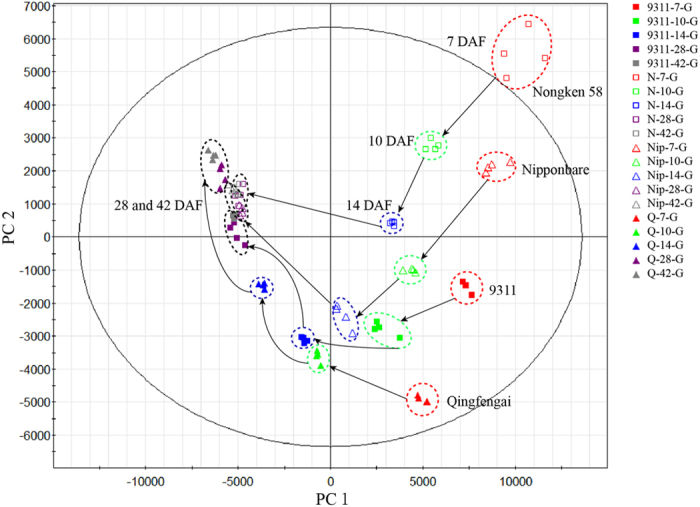
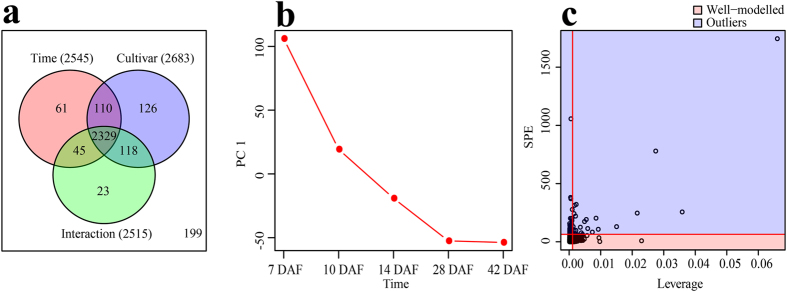
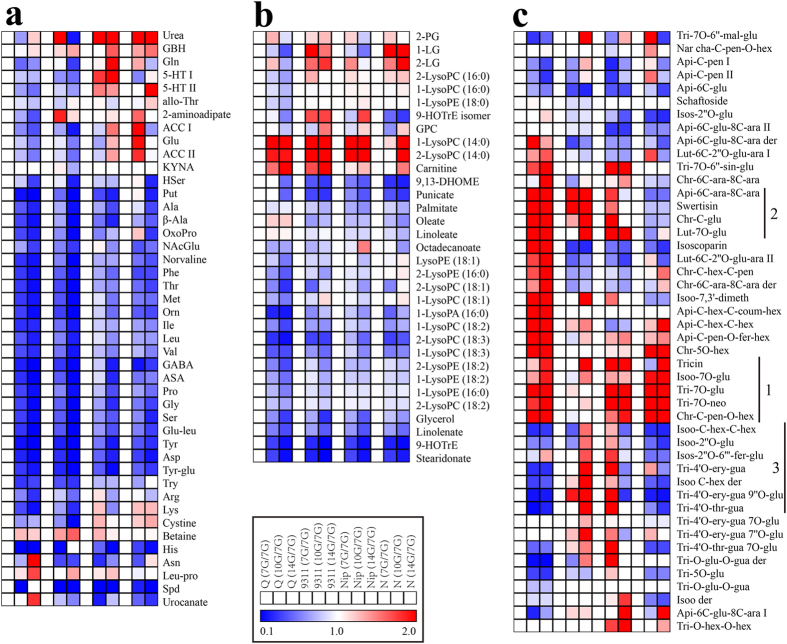
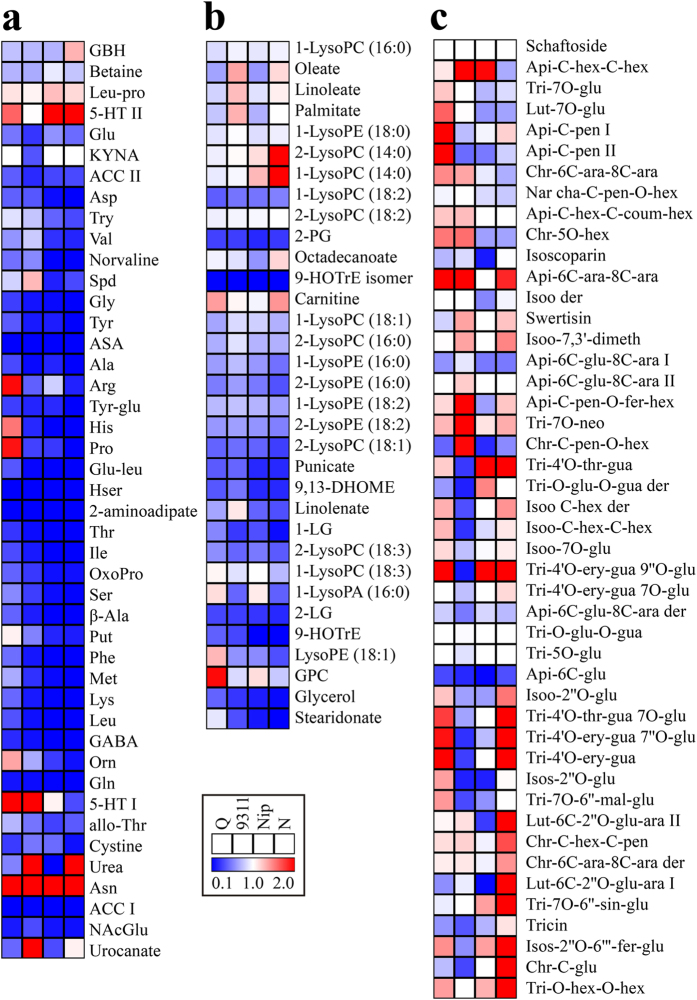
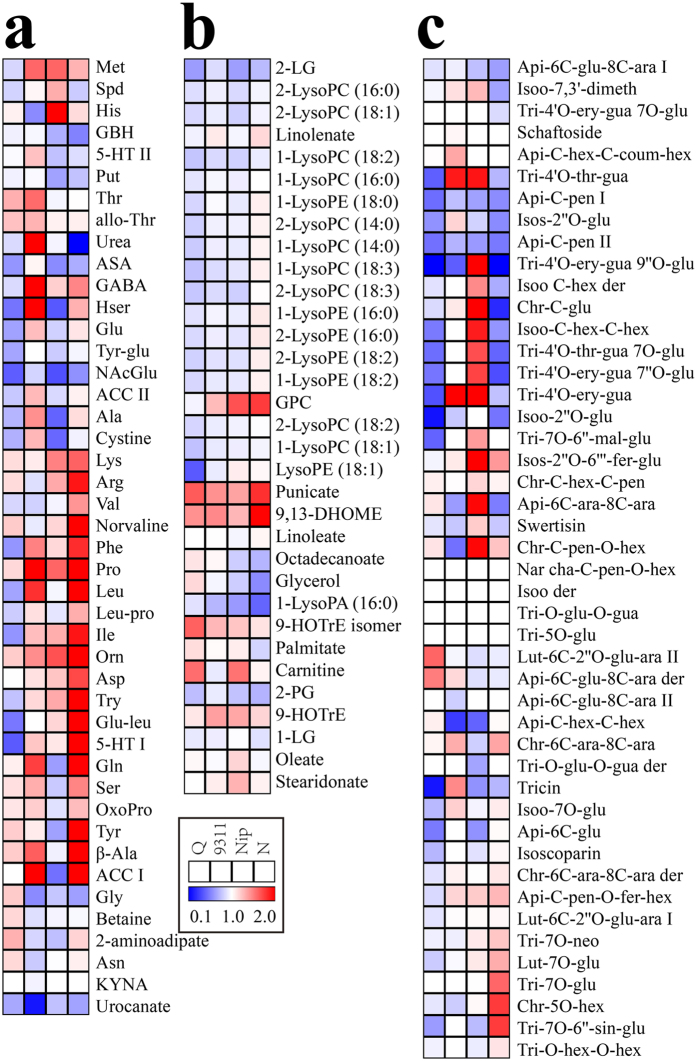
Seed development dedicates to reserve synthesis and accumulation and uncovering its genetic and biochemical mechanisms has been a major research focus. Although proteomic and transcriptomic analyses revealed dynamic changes of genes and enzymes involved, the information regarding concomitant metabolic changes is missing. Here we investigated the dynamic metabolic changes along the rice grain development of two japonica and two indica cultivars using non-targeted metabolomics approach, in which we successfully identified 214 metabolites. Statistical analyses revealed both cultivar and developmental stage dependent metabolic changes in rice grains. Generally, the stage specific metabolic kinetics corresponded well to the physiological status of the developing grains, and metabolic changes in developing rice grain are similar to those of dicot Arabidopsis and tomato at reserve accumulation stage but are different from those of dicots at seed desiccation stage. The remarkable difference in metabolite abundances between japonica and indica rice grain was observed at the reserve accumulation stage. Metabolite-metabolite correlation analysis uncovered potential new pathways for several metabolites. Taken together, this study uncovered both conserved and diverse development associated metabolic kinetics of rice grains, which facilitates further study to explore fundamental questions regarding the evolution of seed metabolic capabilities as well as their potential applications in crop improvement.
Figures
Similar articles
-
Metabolic variation between japonica and indica rice cultivars as revealed by non-targeted metabolomics.Sci Rep. 2014 May 27;4:5067. doi: 10.1038/srep05067. Sci Rep. 2014. PMID: 24861081 Free PMC article.
-
iTRAQ-Based Quantitative Proteomics Analysis of Black Rice Grain Development Reveals Metabolic Pathways Associated with Anthocyanin Biosynthesis.PLoS One. 2016 Jul 14;11(7):e0159238. doi: 10.1371/journal.pone.0159238. eCollection 2016. PLoS One. 2016. PMID: 27415428 Free PMC article.
-
Rice Grain Quality Benchmarking Through Profiling of Volatiles and Metabolites in Grains Using Gas Chromatography Mass Spectrometry.Methods Mol Biol. 2019;1892:187-199. doi: 10.1007/978-1-4939-8914-0_11. Methods Mol Biol. 2019. PMID: 30397807
-
A (1)H HR-MAS NMR-Based Metabolomic Study for Metabolic Characterization of Rice Grain from Various Oryza sativa L. Cultivars.J Agric Food Chem. 2016 Apr 20;64(15):3009-16. doi: 10.1021/acs.jafc.5b05667. Epub 2016 Apr 6. J Agric Food Chem. 2016. PMID: 27030107
-
Dynamic metabolome profiling reveals significant metabolic changes during grain development of bread wheat (Triticum aestivum L.).J Sci Food Agric. 2016 Aug;96(11):3731-40. doi: 10.1002/jsfa.7561. Epub 2016 Jan 13. J Sci Food Agric. 2016. PMID: 26676564
Cited by
-
GC-MS metabolite profiling for specific detection of dwarf somaclonal variation in banana plants.Appl Plant Sci. 2018 Nov 12;6(11):e01194. doi: 10.1002/aps3.1194. eCollection 2018 Nov. Appl Plant Sci. 2018. PMID: 30473940 Free PMC article.
-
Crop metabolomics: from diagnostics to assisted breeding.Metabolomics. 2018 Nov 3;14(11):148. doi: 10.1007/s11306-018-1446-5. Metabolomics. 2018. PMID: 30830402 Review.
-
Dissection of flag leaf metabolic shifts and their relationship with those occurring simultaneously in developing seed by application of non-targeted metabolomics.PLoS One. 2020 Jan 24;15(1):e0227577. doi: 10.1371/journal.pone.0227577. eCollection 2020. PLoS One. 2020. PMID: 31978163 Free PMC article.
-
Automated supervised learning pipeline for non-targeted GC-MS data analysis.Anal Chim Acta X. 2019 Jan 10;1:100005. doi: 10.1016/j.acax.2019.100005. eCollection 2019 Mar. Anal Chim Acta X. 2019. PMID: 33117972 Free PMC article.
-
Metabolic Dynamics of Developing Rice Seeds Under High Night-Time Temperature Stress.Front Plant Sci. 2019 Nov 8;10:1443. doi: 10.3389/fpls.2019.01443. eCollection 2019. Front Plant Sci. 2019. PMID: 31781147 Free PMC article.
References
-
- Itoh J. I. et al. Rice plant development: From zygote to spikelet. Plant Cell Physiol. 46, 23–47 (2005). - PubMed
-
- Liu T., Tausta S. L., Gandotra N. & Nelson T. Rice Seed Development: Highly Resolved Transcriptomic Views. In: Agrawal G. K. & Rakwal R. Eds. Seed Development: OMICS Technologies toward Improvement of Seed Quality and Crop Yield, 61–80 (Springer, New York, 2012).
-
- Huh S. M. et al. Comparative transcriptome profiling of developing caryopses from two rice cultivars with differential dormancy. J. Plant Physiol. 170, 1090–1100 (2013). - PubMed
-
- Xu H. et al. Proteomic analysis of embryo development in rice (Oryza sativa). Planta 235, 687–701 (2012). - PubMed
Publication types
MeSH terms
LinkOut - more resources
Full Text Sources
Other Literature Sources
Molecular Biology Databases
