Improvement of Mitochondria Extract from Saccharomyces cerevisiae Characterization in Shotgun Proteomics Using Sheathless Capillary Electrophoresis Coupled to Tandem Mass Spectrometry
- PMID: 26860395
- PMCID: PMC4885408
- DOI: 10.1093/chromsci/bmw005
Improvement of Mitochondria Extract from Saccharomyces cerevisiae Characterization in Shotgun Proteomics Using Sheathless Capillary Electrophoresis Coupled to Tandem Mass Spectrometry
Abstract
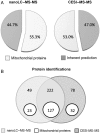
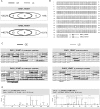
In this work, we describe the characterization of a quantity-limited sample (100 ng) of yeast mitochondria by shotgun bottom-up proteomics. Sample characterization was carried out by sheathless capillary electrophoresis, equipped with a high sensitivity porous tip and coupled to tandem mass spectrometry (CESI-MS-MS) and concomitantly with a state-of-art nano flow liquid chromatography coupled to a similar mass spectrometry (MS) system (nanoLC-MS-MS). With single injections, both nanoLC-MS-MS and CESI-MS-MS 60 min-long separation experiments allowed us to identify 271 proteins (976 unique peptides) and 300 proteins (1,765 unique peptides) respectively, demonstrating a significant specificity and complementarity in identification depending on the physicochemical separation employed. Such complementary, maximizing the number of analytes detected, presents a powerful tool to deepen a biological sample's proteomic characterization. A comprehensive study of the specificity provided by each separating technique was also performed using the different properties of the identified peptides: molecular weight, mass-to-charge ratio (m/z), isoelectric point (pI), sequence coverage or MS-MS spectral quality enabled to determine the contribution of each separation. For example, CESI-MS-MS enables to identify larger peptides and eases the detection of those having extreme pI without impairing spectral quality. The addition of peptides, and therefore proteins identified by both techniques allowed us to increase significantly the sequence coverages and then the confidence of characterization. In this study, we also demonstrated that the two yeast enolase isoenzymes were both characterized in the CESI-MS-MS data set. The observation of discriminant proteotypic peptides is facilitated when a high number of precursors with high-quality MS-MS spectra are generated.
© The Author 2016. Published by Oxford University Press. All rights reserved. For Permissions, please email: journals.permissions@oup.com.
Figures


References
-
- Aebersold R., Mann M.; Mass spectrometry-based proteomics; Nature, (2003); 422: 198–207. - PubMed
-
- Smith R.D., Olivares J.A., Nguyen N.T., Udseth H.R.; Capillary zone electrophoresis mass-spectrometry using an electrospray ionisation interface; Analytical Chemistry, (1988); 60: 436–441.
-
- Mann M., Wilm M.; Electrospray mass-spectrometry for protein characterization; Trends in Biochemical Sciences, (1995); 20: 219–224. - PubMed
-
- Ramautar R., Heemskerk A.A.M., Hensbergen P.J., Deelder A.M., Busnel J.M., Mayboroda O.A.; CE-MS for proteomics: advances in interface development and application; Journal of Proteomics, (2012); 75: 3814–3828. - PubMed
-
- Hjerten S.; High-performance electrophoresis—the elcectrophoretic conterpart of high-performance liquid-chromatography; Journal of Chromatography, (1983); 270: 1–6.
Publication types
MeSH terms
LinkOut - more resources
Full Text Sources
Other Literature Sources
Molecular Biology Databases
Research Materials
Miscellaneous

