

A Mapping Between Structural and Functional Brain Networks
- PMID: 26860437
- PMCID: PMC4939447
- DOI: 10.1089/brain.2015.0408
A Mapping Between Structural and Functional Brain Networks
Abstract
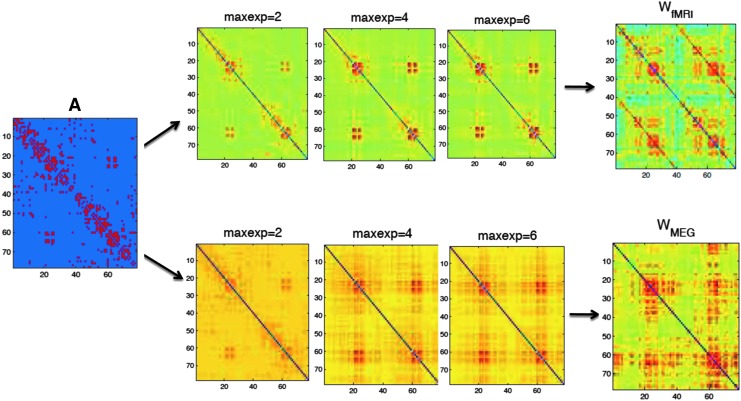
The relationship between structural and functional brain networks is still highly debated. Most previous studies have used a single functional imaging modality to analyze this relationship. In this work, we use multimodal data, from functional MRI, magnetoencephalography, and diffusion tensor imaging, and assume that there exists a mapping between the connectivity matrices of the resting-state functional and structural networks. We investigate this mapping employing group averaged as well as individual data. We indeed find a significantly high goodness of fit level for this structure-function mapping. Our analysis suggests that a functional connection is shaped by all walks up to the diameter in the structural network in both modality cases. When analyzing the inverse mapping, from function to structure, longer walks in the functional network also seem to possess minor influence on the structural connection strengths. Even though similar overall properties for the structure-function mapping are found for different functional modalities, our results indicate that the structure-function relationship is modality dependent.
Keywords: DT1; MEG; brain networks; fMRI; functional connectivity; functional networks; matrix mapping; structural connectivity; structural networks.
Figures


Similar articles
-
Examining resting-state functional connectivity in first-episode schizophrenia with 7T fMRI and MEG.Neuroimage Clin. 2019;24:101959. doi: 10.1016/j.nicl.2019.101959. Epub 2019 Jul 23. Neuroimage Clin. 2019. PMID: 31377556 Free PMC article.
-
Multimodal description of whole brain connectivity: A comparison of resting state MEG, fMRI, and DWI.Hum Brain Mapp. 2016 Jan;37(1):20-34. doi: 10.1002/hbm.22995. Epub 2015 Oct 27. Hum Brain Mapp. 2016. PMID: 26503502 Free PMC article.
-
Structural degree predicts functional network connectivity: a multimodal resting-state fMRI and MEG study.Neuroimage. 2014 Aug 15;97:296-307. doi: 10.1016/j.neuroimage.2014.04.038. Epub 2014 Apr 23. Neuroimage. 2014. PMID: 24769185
-
Alzheimer's disease: The state of the art in resting-state magnetoencephalography.Clin Neurophysiol. 2017 Aug;128(8):1426-1437. doi: 10.1016/j.clinph.2017.05.012. Epub 2017 May 21. Clin Neurophysiol. 2017. PMID: 28622527 Review.
-
Using resting state functional connectivity to unravel networks of tinnitus.Hear Res. 2014 Jan;307:153-62. doi: 10.1016/j.heares.2013.07.010. Epub 2013 Jul 26. Hear Res. 2014. PMID: 23895873 Review.
Cited by
-
Computational Models in Electroencephalography.Brain Topogr. 2022 Jan;35(1):142-161. doi: 10.1007/s10548-021-00828-2. Epub 2021 Mar 29. Brain Topogr. 2022. PMID: 33779888 Free PMC article. Review.
-
Structure-Function Network Mapping and Its Assessment via Persistent Homology.PLoS Comput Biol. 2017 Jan 3;13(1):e1005325. doi: 10.1371/journal.pcbi.1005325. eCollection 2017 Jan. PLoS Comput Biol. 2017. PMID: 28046127 Free PMC article.
-
Relationships between cortical myeloarchitecture and electrophysiological networks.Proc Natl Acad Sci U S A. 2016 Nov 22;113(47):13510-13515. doi: 10.1073/pnas.1608587113. Epub 2016 Nov 8. Proc Natl Acad Sci U S A. 2016. PMID: 27830650 Free PMC article.
-
Unraveling Hierarchical Brain Dysfunction in Major Depressive Disorder: A Multimodal Imaging and Transcriptomic Approach.Hum Brain Mapp. 2025 Jul;46(10):e70277. doi: 10.1002/hbm.70277. Hum Brain Mapp. 2025. PMID: 40590368 Free PMC article.
-
Age-related differences in structural and resting-state functional brain network organization across the adult lifespan: A cross-sectional study.Aging Brain. 2024 Jan 5;5:100105. doi: 10.1016/j.nbas.2023.100105. eCollection 2024. Aging Brain. 2024. PMID: 38273866 Free PMC article.
References
-
- Bullmore E, Sporns O. 2012. The economy of brain network organization. Nat Rev Neurosci 13:336–349 - PubMed
Publication types
MeSH terms
Grants and funding
LinkOut - more resources
Full Text Sources
Other Literature Sources
