. 2016 Feb 9:16:78.
doi: 10.1186/s12885-016-2119-2.

Tumor slice culture system to assess drug response of primary breast cancer

Affiliations

Tumor slice culture system to assess drug response of primary breast cancer

Kishan A T Naipal et al. BMC Cancer. .

Abstract

Background: The high incidence of breast cancer has sparked the development of novel targeted and personalized therapies. Personalization of cancer treatment requires reliable prediction of chemotherapy responses in individual patients. Effective selection can prevent unnecessary treatment that would mainly result in the unwanted side effects of the therapy. This selection can be facilitated by characterization of individual tumors using robust and specific functional assays, which requires development of powerful ex vivo culture systems and procedures to analyze the response to treatment.

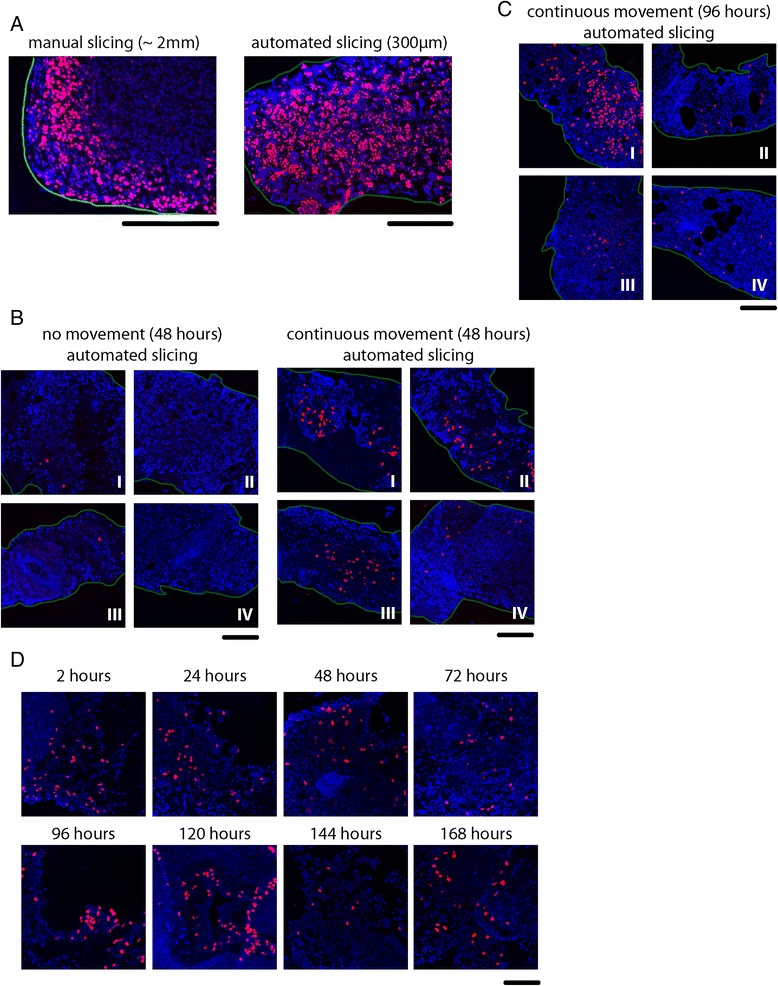
Methods: We optimized culture methods for primary breast tumor samples that allowed propagation of tissue ex vivo. We combined several tissue culture strategies, including defined tissue slicing technology, growth medium optimization and use of a rotating platform to increase nutrient exchange.

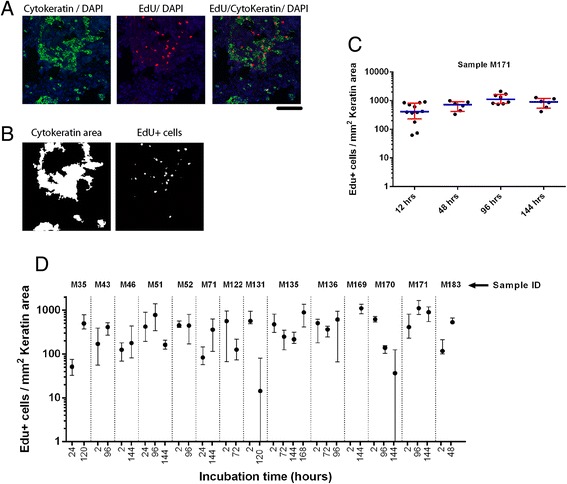
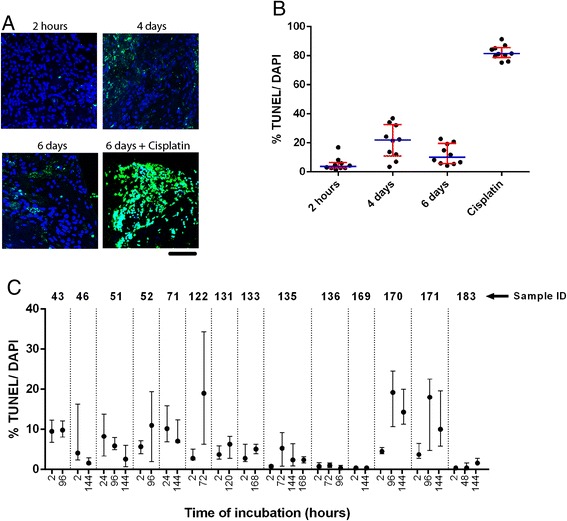
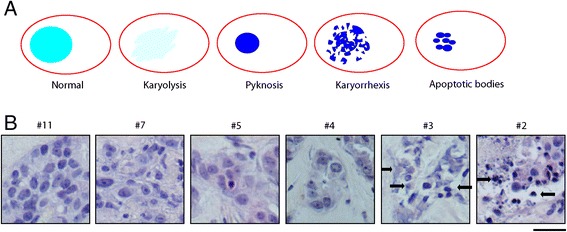
Results: We could maintain tissue cultures for at least 7 days without losing tissue morphology, viability or cell proliferation. We also developed methods to determine the cytotoxic response of individual tumors to the chemotherapeutic treatment FAC (5-FU, Adriamycin [Doxorubicin] and Cyclophosphamide). Using this tool we designated tumors as sensitive or resistant and distinguished a clinically proven resistant tumor from other tumors.

Conclusion: This method defines conditions that allow ex vivo testing of individual tumor responses to anti-cancer drugs and therefore might improve personalization of breast cancer treatment.


Figures

Fig. 1
Fig. 1
Improvement of organotypic tissue slice viability. a Manually sliced tumor slices were incubated for 2 hours in the presence of EU (Ethynyl Uridine) before fixation. During this time penetration of EU is limited to 10–20 cell layers from the edge of the slice. Automatically sliced (300 μm) tumor slices display EU incorporation across the entire depth of the slice within a 2-hour labeling period. b Constant orbital movement (60 rpm) significantly increased the number of EdU positive cells after 48 hours incubation compared to static culture conditions. c EdU incorporation after 96 hours of culturing under constant movement. d Prolonged culture of 300 μm tumor slices from one individual tumor using continuous movement and Medium I. Blue = DAPI, Red = EdU, Green lines indicate the edge of the tumor slice. Scale bars indicate 100 μm
Fig. 2
Fig. 2
Assessment of proliferation in tumor slices by EdU incorporation. a Co-staining for EdU (red), Cytokeratin (green) and DAPI (blue). Scale bar indicates 100 μm. b Screenshots of semi-automated measurement of Cytokeratin area and number of EdU positive cells using image analysis software. c Example of tumor proliferation after prolonged culture of tumor slices. Multiple image fields were analyzed per tumor slice. Heterogeneity in proliferation is visualized in this graphical representation by interquartile ranges. Each black dot represents one image field. Red bars indicate interquartile range and blue bars represent median values. d Proliferation rate of multiple tumors after incubation for up to seven days. Maximum incubation times varied per tumor depending on availability of tumor slices. Black dots indicate median values and error bars represent interquartile range
Fig. 3
Fig. 3
Induction of cell death after prolonged culture of tumor slices is minimal. a Representative images of tumor slices from the same tumor displayed similar TUNEL staining intensities at 2 hours, 4 days and 6 days of incubation. Tumor slices incubated with high concentrations (10 μg/ml) of the chemotherapeutic compound Cisplatin revealed massive TUNEL signal. This specific signal was regarded as the positive control for TUNEL signal. Blue = DAPI, Green = TUNEL. Scale bars represent 100 μm. b Quantification of TUNEL in different tumor slices. TUNEL signal is variable due to tumor heterogeneity. Each black dot represents one image field. For each image field the percentage of TUNEL-positive DAPI pixels is given. Error bars indicate interquartile range and blue bars represent median values. c TUNEL signal was determined for multiple tumors after short and prolonged incubation. Incubation times varied per tumor depending on availability of tumor slices. Black dots indicate median values. Error bars indicate interquartile range
Fig. 4
Fig. 4
Assessment of drug response by aberrant nuclear morphology. a Nuclear morphology suggestive for tumor cell death included: Karyolysis: nuclear fading caused by dissolution of the chromatin, Pyknosis: irreversible condensation of the chromatin causing nuclei to shrink in size, Karyorrhexis: destructive fragmentation of a pyknotic nucleus, Apoptotic bodies: late stage apoptosis with fragmented nuclei. b An example of altered nuclear morphology (black arrows) observed in a single tumor after increasing dilution of FAC treatment. Dilution #3 was the lowest dilution at which altered nuclear morphology was observed in this tumor. Scale bar represents 50 μm
Fig. 5
Fig. 5
Analytical methods to asses cell proliferation and cell death in response to FAC treatment. a 3D representation of morphologic examination, EdU incorporation and TUNEL analysis per individual tumor. For every tumor the dilution at which a threshold was observed was plotted for each analytical method. Most sensitive tumors cluster in the upper most front part of the graph and most resistant tumors cluster at the lower back side of the 3D graph. Red box represents the resistant tumors based on arbitrary limits. b Scatterplots comparing two analytical methods for therapy response. For every tumor the dilution at which a threshold was observed was plotted for each analytical method. The resistant tumors based on arbitrary limits are outlined in red

References

    1. Jemal A, Bray F, Center MM, Ferlay J, Ward E, Forman D. Global cancer statistics. CA Cancer J Clin. 2011;61(2):69–90. doi: 10.3322/caac.20107. - DOI - PubMed
    1. Campos SM, Winer EP. Hormonal therapy in postmenopausal women with breast cancer. Oncology. 2003;64(4):289–99. doi: 10.1159/000070284. - DOI - PubMed
    1. Burdall SE, Hanby AM, Lansdown MR, Speirs V. Breast cancer cell lines: friend or foe? Breast Cancer Res. 2003;5(2):89–95. doi: 10.1186/bcr577. - DOI - PMC - PubMed
    1. Seifert HH, Meyer A, Cronauer MV, Hatina J, Muller M, Rieder H, et al. A new and reliable culture system for superficial low-grade urothelial carcinoma of the bladder. World J Urol. 2007;25(3):297–302. doi: 10.1007/s00345-007-0166-7. - DOI - PubMed
    1. Sato T, Stange DE, Ferrante M, Vries RG, Van Es JH, Van den Brink S, et al. Long-term expansion of epithelial organoids from human colon, adenoma, adenocarcinoma, and Barrett's epithelium. Gastroenterology. 2011;141(5):1762–72. doi: 10.1053/j.gastro.2011.07.050. - DOI - PubMed

Publication types

MeSH terms

Supplementary concepts