. 2016 Nov;9(6):1466-1476.
doi: 10.1038/mi.2016.11. Epub 2016 Feb 10.

Mast cell-derived neurotrophin 4 mediates allergen-induced airway hyperinnervation in early life

Affiliations

Mast cell-derived neurotrophin 4 mediates allergen-induced airway hyperinnervation in early life

K R Patel et al. Mucosal Immunol. 2016 Nov.

Abstract

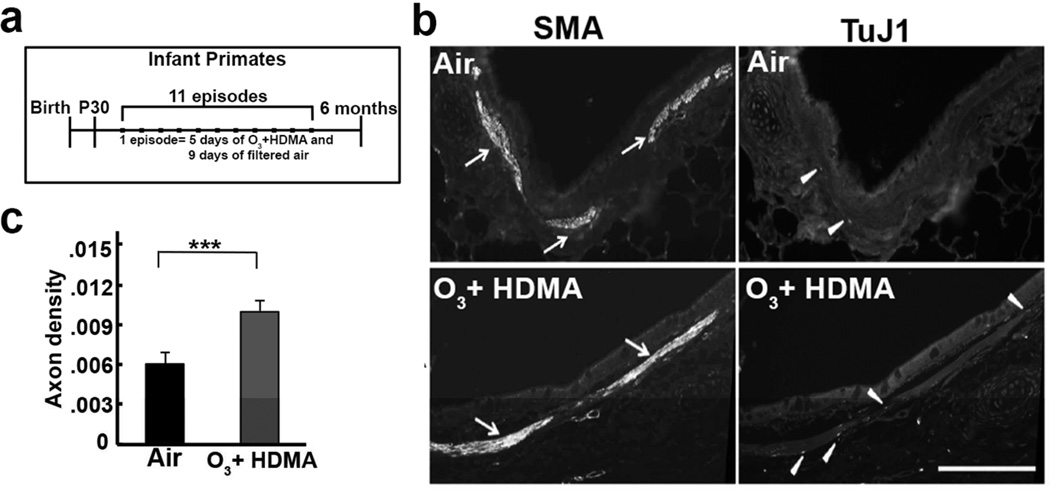
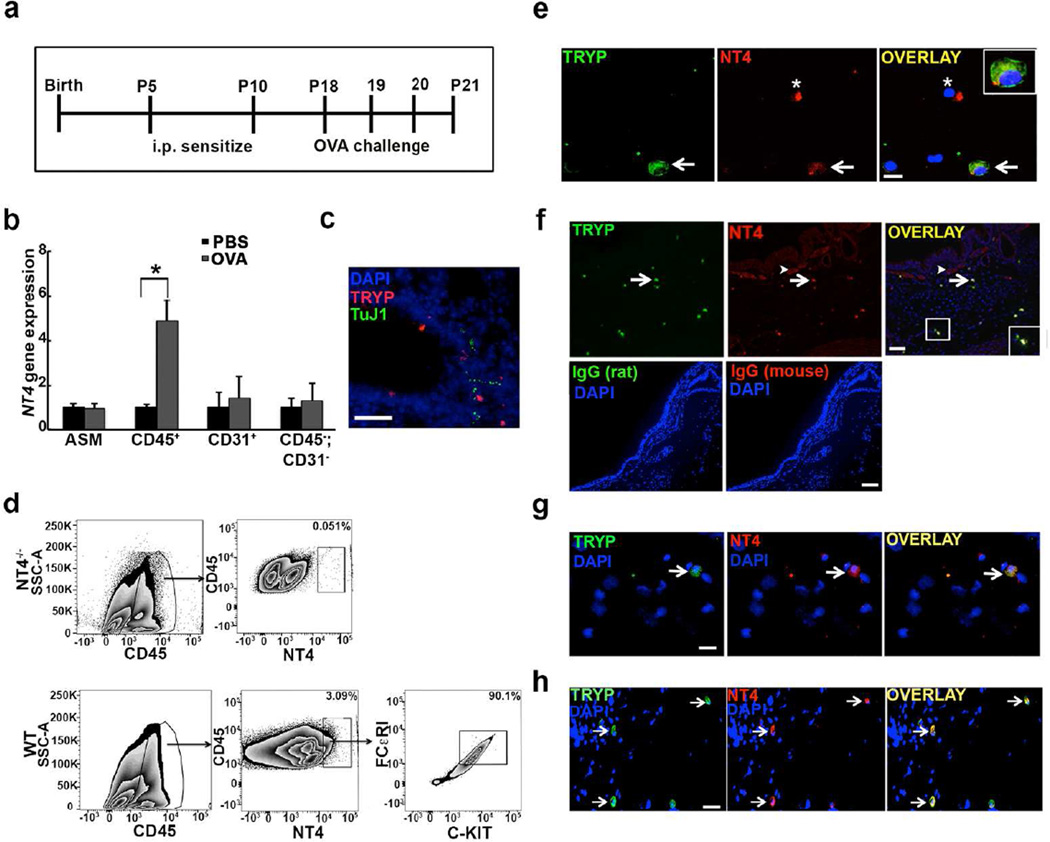
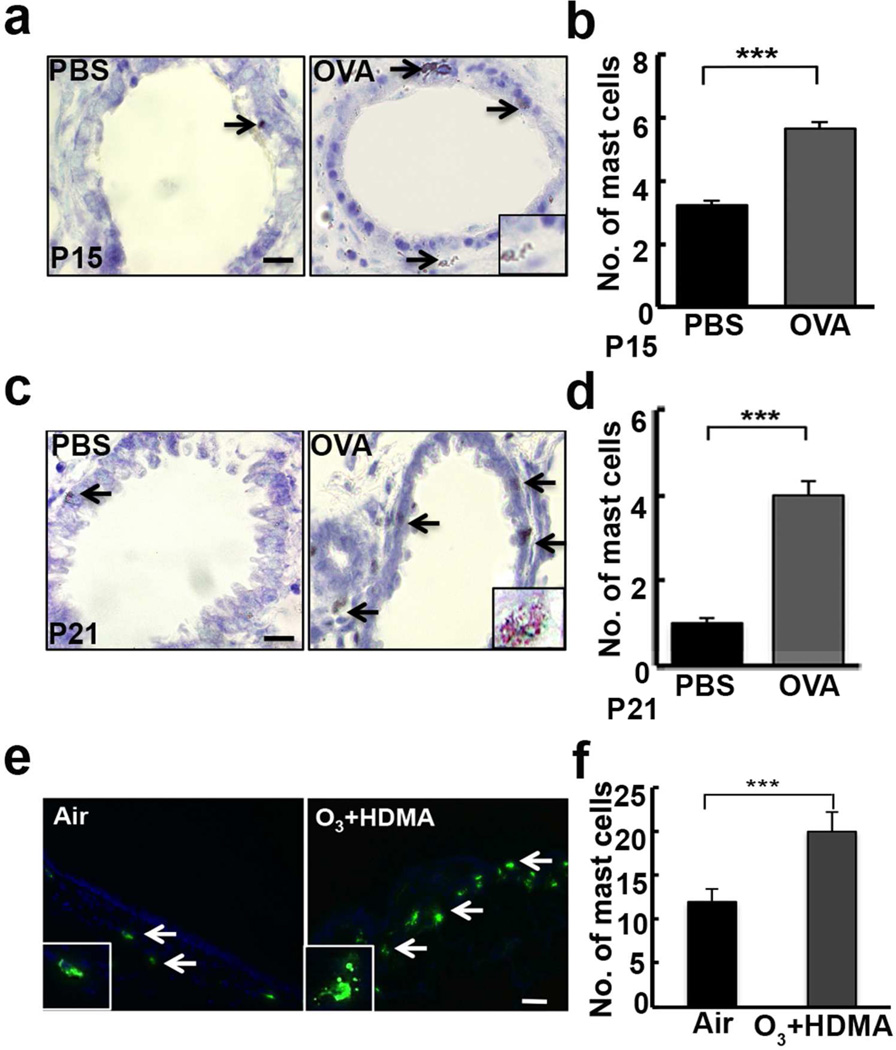
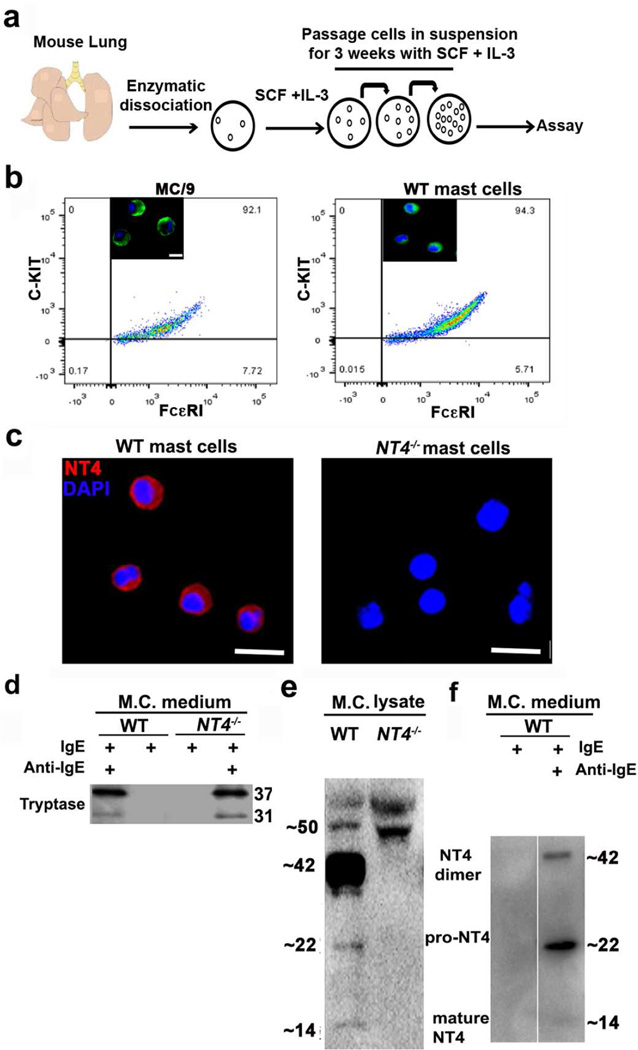
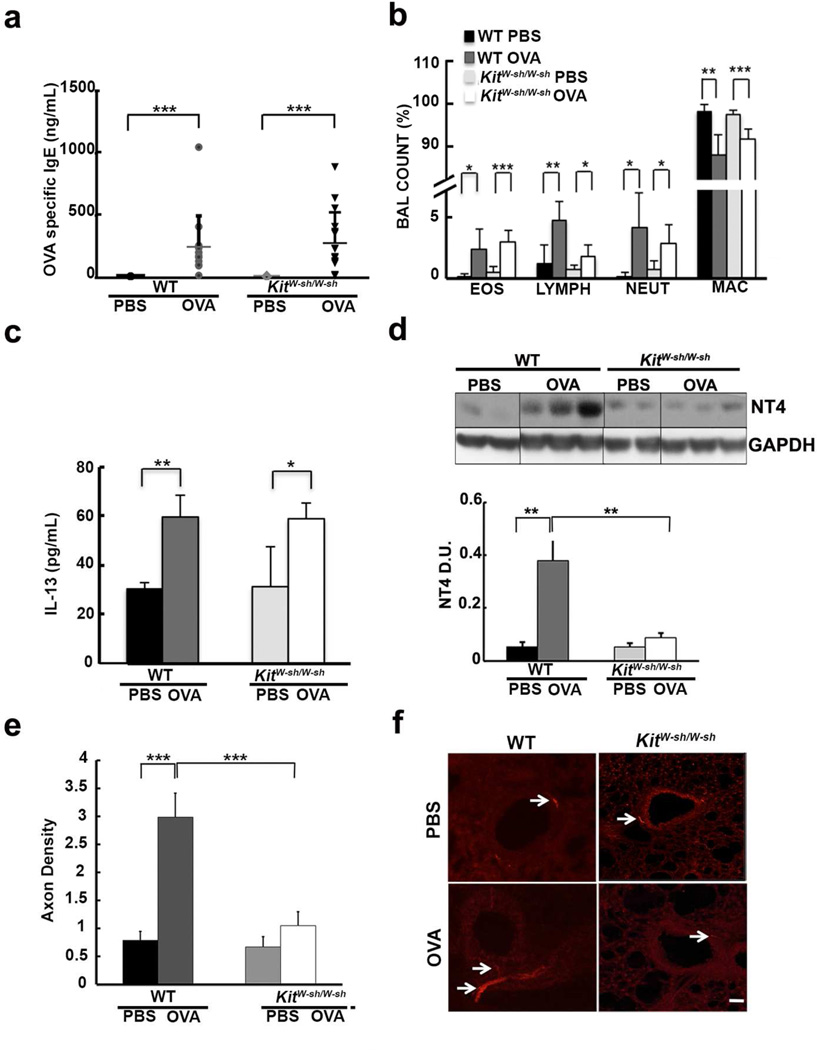
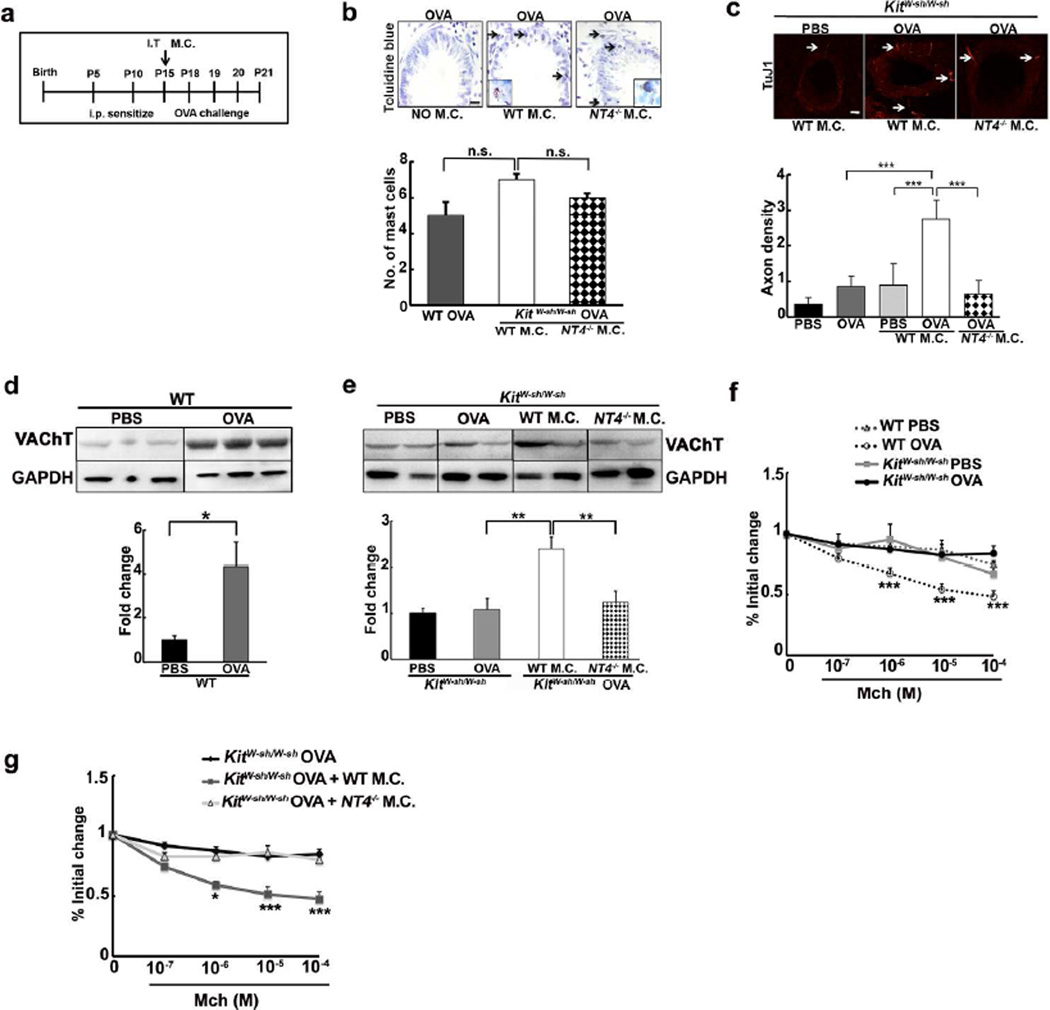
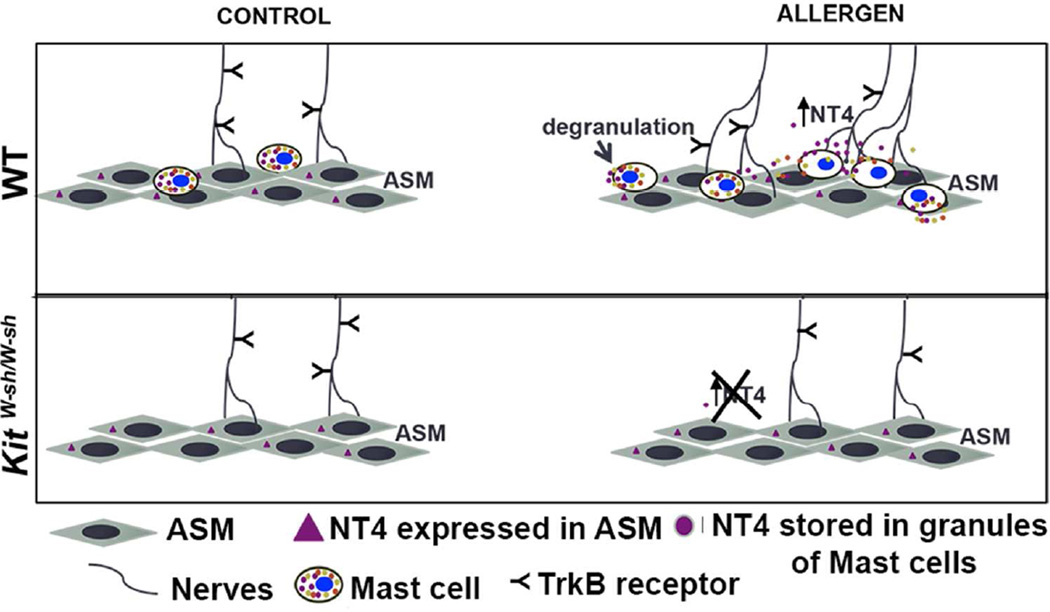
Asthma often progresses from early episodes of insults. How early-life events connect to long-term airway dysfunction remains poorly understood. We demonstrated previously that increased neurotrophin 4 (NT4) levels following early-life allergen exposure cause persistent changes in airway smooth muscle (ASM) innervation and airway hyper-reactivity (AHR) in mice. Herein, we identify pulmonary mast cells as a key source of aberrant NT4 expression following early insults. NT4 is selectively expressed by ASM and mast cells in mice, nonhuman primates, and humans. We show in mice that mast cell-derived NT4 is dispensable for ASM innervation during development. However, upon insults, mast cells expand in number and degranulate to release NT4 and thus become the major source of NT4 under pathological condition. Adoptive transfer of wild-type mast cells, but not NT4-/- mast cells restores ASM hyperinnervation and AHR in KitW-sh/W-sh mice following early-life insults. Notably, an infant nonhuman primate model of asthma also exhibits ASM hyperinnervation associated with the expansion and degranulation of mast cells. Together, these findings identify an essential role of mast cells in mediating ASM hyperinnervation following early-life insults by producing NT4. This role may be evolutionarily conserved in linking early insults to long-term airway dysfunction.


Conflict of interest statement

The authors declare no conflict of interest.

Figures

Figure 1
Figure 1
Early life allergen exposure increases airway innervation in nonhuman primate lungs. (a) Experimental scheme of O3 and HDMA exposure in infant nonhuman primates. Controls were exposed to filtered air. (b) Assessment of ASM innervation by TuJ1 and alpha-SMA double staining of proximal lung sections from control and O3+HDMA exposed infant rhesus monkeys at 6 months. Arrows indicate ASM and arrowheads indicate innervating nerves. Scale bar, 100 µm. (c) Quantification of axon density in ASM of the lungs exposed to filtered air and O3+HDMA. Axonal density was measured by normalizing the TuJ1 immunoreactivity to SMA-positive area. A total of 25 sections, 5 from each infant rhesus monkey lung, were quantified. Data represent the mean and SEM. ***P<0.001.
Figure 2
Figure 2
Mast cells are a candidate source of increased NT4 levels in the lung after early life allergen exposure. (a) Experimental protocol of OVA sensitization and challenge in neonatal mice. Controls received PBS challenges. (b) Comparison of NT4 gene expression in ASM and 3 major cell groups sorted from the lungs of PBS- and OVA-exposed mice at P21. ASM cells were isolated from SMA-GFP; NG2-dsRed mice and were pooled from 5–6 mouse lungs as one sample. N=3. (c) Double staining for mast cells (red) and nerves (green) in mouse lungs at P21 using a tryptase antibody and the TuJ1 antibody. Scale bar, 50 µm. (d) Expression of NT4 in lung immune cells. CD45+ immune cells were gated for NT4 using NT4−/− cells as negative control. NT4+ immune cells were then gated for c-kit and FcεRI. (e) Double staining of the immune cells in BAL for NT4 and tryptase. BAL was collected from OVA-exposed mice at P21. The arrow indicates the double positive cells. * indicates a cell (likely macrophage) with polarized NT4 staining. Insert shows an enlarge image of a double positive mast cell. Scale bar, 25 µm. (f) NT4 and tryptase double staining of 6-month-old rhesus monkey lungs. Arrows indicate double positive mast cells. Arrowheads indicate NT4 expression in ASM. The IgG isotype controls showed no staining. Insert shows an enlarge image of a double positive mast cell. Scale bar, 50 µm. (g) Double staining of the cells in endotracheal aspirates from respiratory virus-infected children for NT4 and tryptase. Arrow indicates the double positive cell. Scale bar, 25 µm. (h) Double staining of adult human lung sections for NT4 and tryptase. Arrow indicates double positive mast cells. Scale bar, 50µm. Nuclei were stained by DAPI in all images.
Figure 3
Figure 3
Correlated changes in mast cell number and ASM innervation during early life insult in mice. Toluidine blue staining and quantification for mast cells in control and OVA-exposed lungs at P15 (a, b) and P21 (c, d). Arrows point to stained mast cells. Scale bars, 10 µm. Inserts in (a, c) provide a zoomed-in view of spewed granules from a mast cell after OVA exposure. Data represent the average and SEM from 10 non-overlapping, 100× images (0.015 mm3) in mid-lobe sections of each mouse lung and 5 mice for each condition. *P<0.05; ***P<0.001. (e) Tryptase staining of control and O3+HDMA exposed infant rhesus monkey lungs. Arrows indicate tryptase+ mast cells in ASM. Inserts provide a zoomed-in view of tryptase+ granules that were mostly inside of a mast cell of control lungs but got spewed from a mast cell in O3+HDMA exposed lungs. Scale bar, 50 µm. (f) Quantification of tryptase+ mast cells in ASM of control and O3+HDMA exposed infant rhesus monkey lungs. A total of 25 sections from 5 infant monkeys were quantified. Data represent the mean and SEM per 20× field (0.14 mm2). ***P<0.001.
Figure 4
Figure 4
NT4 release requires degranulation of mast cells. (a) Experimental protocol of primary pulmonary mast cell culture. (b) Flow cytometry analysis of c-kit and FcεR1 expression by primary mast cells and MC/9 mast cells. Inserts showed tryptase staining of cells in culture. (c) Staining of primary pulmonary mast cells for NT4. No NT4 staining was detected in NT4−/− primary mast cells. Nuclei were stained by DAPI. Scale bar, 10 µm. (d–f) Western blot analysis of tryptase and NT4 release in the medium from primary pulmonary mast cells treated with IgE alone (0.5 µg/ml) or with both IgE and anti-IgE (1 µg/ml). Data shown represent results from 5 independent experiments. The specificity of NT4 antibody for Western blot analysis was validated (in e) using cell lysates of wild type and NT4−/− primary mast cells in culture.
Figure 5
Figure 5
Mast cells are required for increased ASM innervation after early life OVA exposure in mice. (a) Serum levels of OVA-specific IgE in PBS- and OVA-exposed, WT and KitW-sh/W-sh mice at P21. N=9. (b) Differential BAL count of PBS- and OVA-exposed WT and KitW-sh/W-sh mice at P21. The numbers of eosinophils (Eos), lymphocytes (Lymph), neutrophils (Neut), and macrophages (Mac) are shown. N=9. (c) Serum levels of IL-13 in PBS- and OVA-exposed WT and KitW-sh/W-sh mice at P21 measured by ELISA. N=9. (d) Western blot analysis for NT4 protein levels in the lungs of PBS- and OVA-exposed, WT and KitW-sh/W-sh mice at P21. Each lane represents 1 mouse. GAPDH was loading control. Data were normalized to PBS, wild type control mice. N=9. (e) Quantification of the ASM innervation density in control and OVA-exposed, WT and KitW-sh/W-sh mice at P21. Data represent the average and SEM from 4 airways (0.1–0.3 mm2 in luminal area) of each mouse and 10–12 mice for each condition. (f) Representative images of TuJ1 staining of the airway from control and OVA-exposed, WT and KitW-sh/W-sh mice at P21. Arrows indicate TuJ1+ axons. Scale bar, 50 µm. *P<0.05. ** P<0.01. ***P<0.001.
Figure 6
Figure 6
Reconstitution of the mast cell pool in the lungs of KitW-sh /W-sh mice restores early life allergen-induced increase in ASM innervation and AHR. (a) Experimental protocol of adoptive transfer of primary pulmonary mast cells (M.C.) during OVA exposure. Approximately 20,000 mast cells were installed intra-tracheally (I.T.) per mouse at P15. (b) Representative images of toluidine blue staining of mast cells in the lungs of KitW-sh/W-sh mice with and without adoptive transfer of mast cells at P21. Arrows indicate pulmonary mast cells in the lung. Scale bar, 10 µm. Inserts showed degranulation of engrafted mast cells. Quantification of mast cells in KitW-sh/W-sh mice after adoptive transfer at P21 was shown in bar graph. Data represent the average and SEM from 10 non-overlapping, 100× images (0.015 mm2) in mid-lobe sections of each mouse lung and 4 mice for each condition. (c) Representative images of TuJ1 staining of airways (0.1–0.3 mm2 in luminal area) from PBS- and OVA-exposed KitW-sh/W-sh mice that received intra-tracheal instillation of WT or NT4−/− pulmonary mast cells. Arrows indicate TuJ1-labelled axons. N=6 mice from 3 independent experiments. Scale bars, 50 µm. The bar graph shows the quantification of the innervation density of ASM in PBS- and OVA-exposed KitW-sh/W-sh mice with and without adoptive transfer of WT and NT4−/− mast cells. A total of 25 airways from 5 mice of each group were quantified. Data represent mean±SEM. (d) Western blot analysis for cholinergic innervation of the lung at P21. Lung homogenates collected at P21 from PBS- and OVA-exposed wild type mice were assayed for the levels of VAChT. Each lane represents 1 mouse. GAPDH was loading control. Data were normalized to PBS control mice. N=12. (e) Western blot analysis for cholinergic innervation in lungs of KitW-sh/W-sh mice with and without reconstituted with primary mast cells at P21. Each lane represents 1 mouse. GAPDH was loading control. N=12. Data were normalized to PBS-exposed KitW-sh/W-sh mice. (f) Measurement of airway contraction in response to increasing doses of methacholine using precision cut lung slices from wild type and KitW-sh/W-sh mice with and without OVA exposure. The size of the airway lumen was normalized to the baseline before methacholine stimulation. Data represented mean±SEM from 30 airways of 3 mice for each condition. Two-way ANOVA for multi-variance was used for statistical analysis. Statistically significant differences between WT and KitW-sh/W-sh mice following OVA exposure were marked. (g) Measurement of airway contraction in response to increasing doses of methacholine using precision cut lung slices from OVA-exposed KitW-sh/W-sh mice with and without mast cell transfer. Data represented mean±SEM from 30 airways of 3 mice for each condition. Statistically significant differences between WT and NT4−/− mast cell transfer were marked. The same results of OVA-exposed KitW-sh/W-sh mice were plotted in both (f) and (g). *P<0.05. **P<0.01. ***P<0.001.
Figure 7
Figure 7
A model of pulmonary mast cells as a key source of elevated NT4 for early life allergen-induced neuroplasticity. Allergen exposure increases the number of mast cells and triggers degranulation to release NT4, thereby increasing NT4-dependent ASM innervation. This in turn leads to AHR. Without mast cells in the lung, early life allergen-induced neuroplasticity no longer happens. As a result, there is a lack of AHR in KitW-sh/W-sh mice after early life allergen exposure.

Similar articles

Cited by

References

    1. Maddox L, Schwartz DA. The pathophysiology of asthma. Annu. Rev. Med. 2002;53:477–498. - PubMed
    1. Aven L, et al. An NT4/TrkB-dependent increase in innervation links early life allergen exposure to persistent airway hyperreactivity. FASEB J. 2014;28:897–907. - PMC - PubMed
    1. Dakhama A, et al. The enhancement or prevention of airway hyperresponsiveness during reinfection with respiratory syncytial virus is critically dependent on the age at first infection and IL-13 production. J. Immunol. 2005;175:1876–1883. - PubMed
    1. Stern DA, Morgan WJ, Halonen M, Wright AL, Martinez FD. Wheezing and bronchial hyper-responsiveness in early childhood as predictors of newly diagnosed asthma in early adulthood: a longitudinal birth-cohort study. Lancet. 2008;372:1058–1064. - PMC - PubMed
    1. Gelfand EW. Development of asthma is determined by the age-dependent host response to respiratory virus infection: therapeutic implications. Curr. Opin. Immunol. 2012;24:713–719. - PMC - PubMed

Publication types

MeSH terms