

DNA Methylation and BMI: Investigating Identified Methylation Sites at HIF3A in a Causal Framework
- PMID: 26861784
- PMCID: PMC4839211
- DOI: 10.2337/db15-0996
DNA Methylation and BMI: Investigating Identified Methylation Sites at HIF3A in a Causal Framework
Abstract
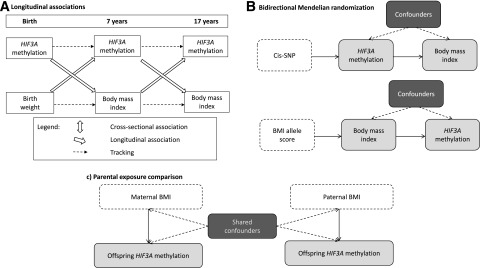
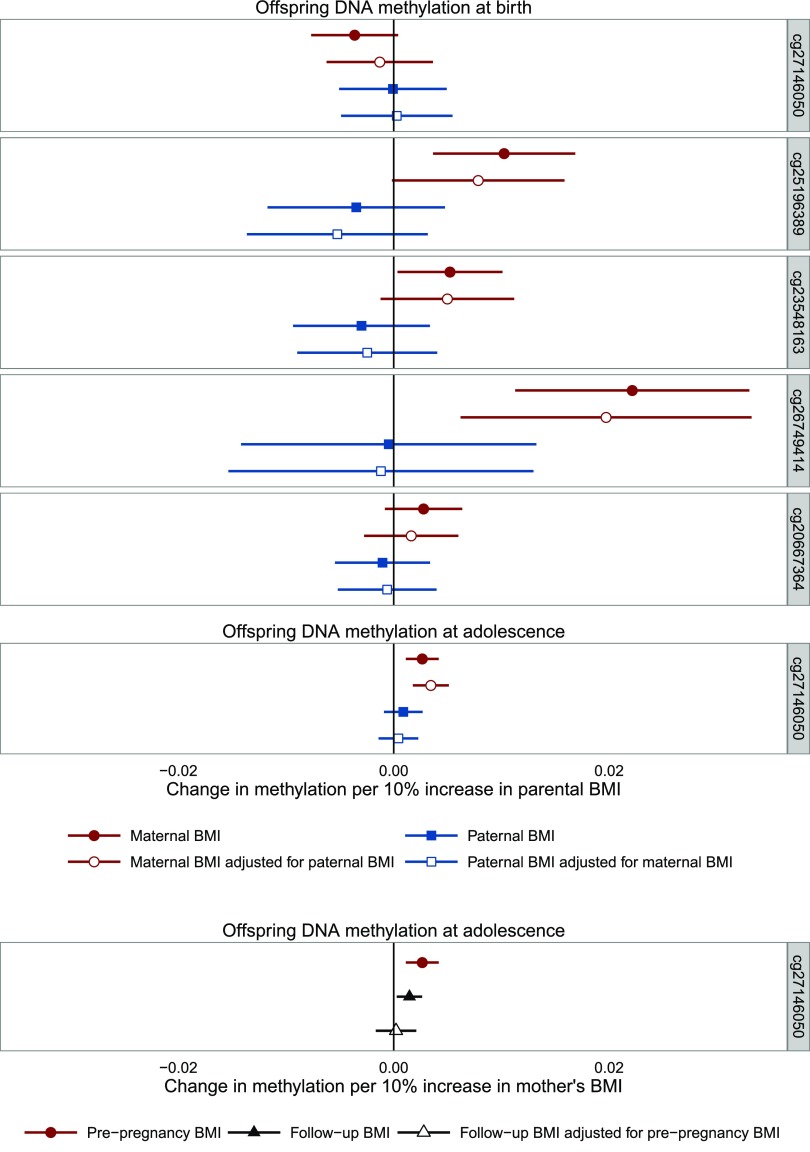
Multiple differentially methylated sites and regions associated with adiposity have now been identified in large-scale cross-sectional studies. We tested for replication of associations between previously identified CpG sites at HIF3A and adiposity in ∼1,000 mother-offspring pairs from the Avon Longitudinal Study of Parents and Children (ALSPAC). Availability of methylation and adiposity measures at multiple time points, as well as genetic data, allowed us to assess the temporal associations between adiposity and methylation and to make inferences regarding causality and directionality. Overall, our results were discordant with those expected if HIF3A methylation has a causal effect on BMI and provided more evidence for causality in the reverse direction (i.e., an effect of BMI on HIF3A methylation). These results are based on robust evidence from longitudinal analyses and were also partially supported by Mendelian randomization analysis, although this latter analysis was underpowered to detect a causal effect of BMI on HIF3A methylation. Our results also highlight an apparent long-lasting intergenerational influence of maternal BMI on offspring methylation at this locus, which may confound associations between own adiposity and HIF3A methylation. Further work is required to replicate and uncover the mechanisms underlying the direct and intergenerational effect of adiposity on DNA methylation.
© 2016 by the American Diabetes Association. Readers may use this article as long as the work is properly cited, the use is educational and not for profit, and the work is not altered.
Figures
References
-
- van Dijk SJ, Molloy PL, Varinli H, Morrison JL, Muhlhausler BS; Members of EpiSCOPE. Epigenics and human obesity. Int J Obes (London) 2015;39:85–97 - PubMed
-
- Almén MS, Jacobsson JA, Moschonis G, et al. Genome wide analysis reveals association of a FTO gene variant with epigenetic changes. Genomics 2012;99:132–137 - PubMed
MeSH terms
Substances
Grants and funding
- 19169/CRUK_/Cancer Research UK/United Kingdom
- G0701594/MRC_/Medical Research Council/United Kingdom
- MC_PC_15018/MRC_/Medical Research Council/United Kingdom
- MC_UU_12013/1/MRC_/Medical Research Council/United Kingdom
- R01 DK103246/DK/NIDDK NIH HHS/United States
- 088806/WT_/Wellcome Trust/United Kingdom
- 102215/WT_/Wellcome Trust/United Kingdom
- MC_UU_12013/5/MRC_/Medical Research Council/United Kingdom
- MR/M009351/1/MRC_/Medical Research Council/United Kingdom
- A19169/CRUK_/Cancer Research UK/United Kingdom
- MC_UU_12013/8/MRC_/Medical Research Council/United Kingdom
- G9815508/MRC_/Medical Research Council/United Kingdom
- MC_UU_12013/2/MRC_/Medical Research Council/United Kingdom
LinkOut - more resources
Full Text Sources
Other Literature Sources
Medical
