. 2016 Feb 9:15:79.
doi: 10.1186/s12936-016-1121-0.

Estimating malaria transmission intensity from Plasmodium falciparum serological data using antibody density models

Affiliations

Estimating malaria transmission intensity from Plasmodium falciparum serological data using antibody density models

Emilie Pothin et al. Malar J. .

Abstract

Background: Serological data are increasingly being used to monitor malaria transmission intensity and have been demonstrated to be particularly useful in areas of low transmission where traditional measures such as EIR and parasite prevalence are limited. The seroconversion rate (SCR) is usually estimated using catalytic models in which the measured antibody levels are used to categorize individuals as seropositive or seronegative. One limitation of this approach is the requirement to impose a fixed cut-off to distinguish seropositive and negative individuals. Furthermore, the continuous variation in antibody levels is ignored thereby potentially reducing the precision of the estimate.

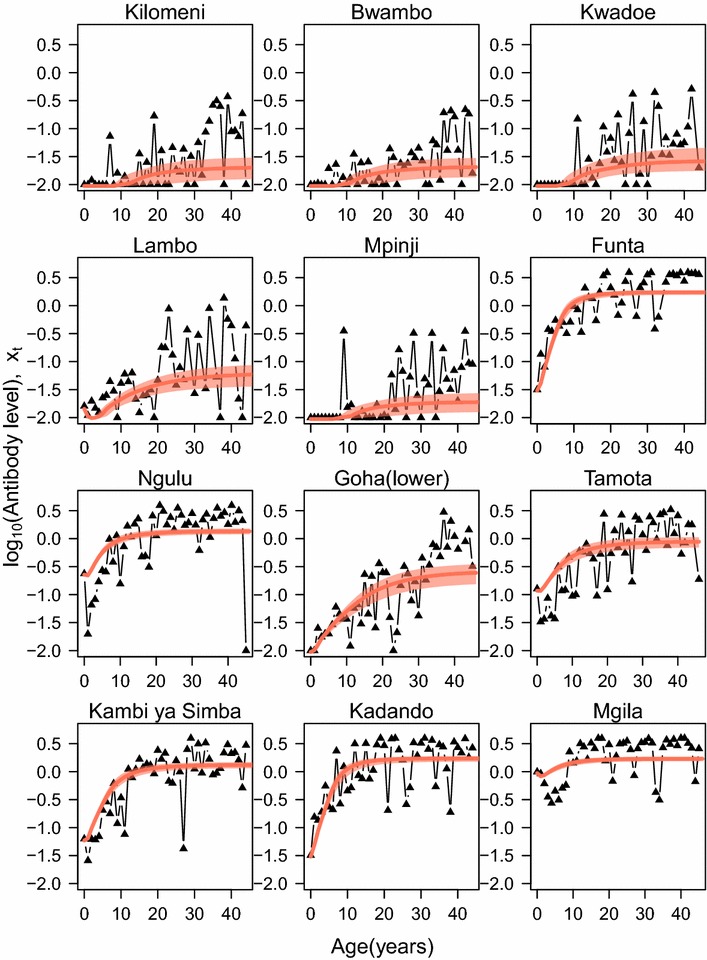
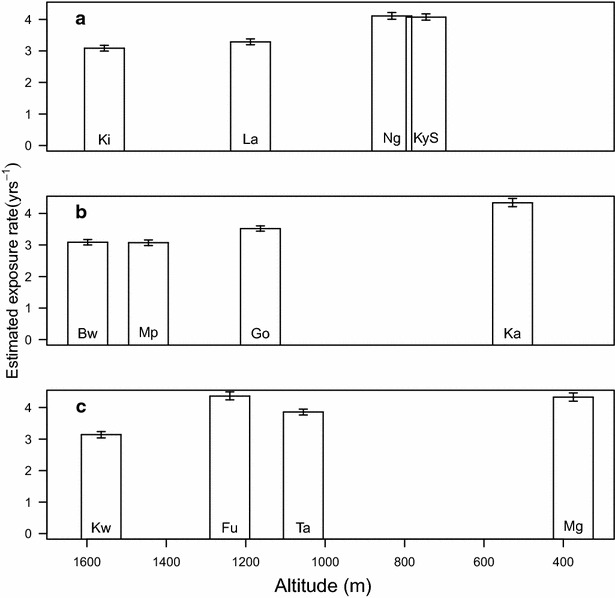
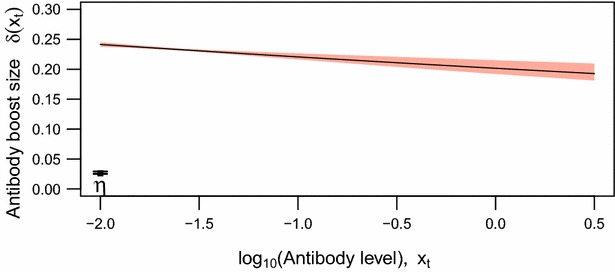
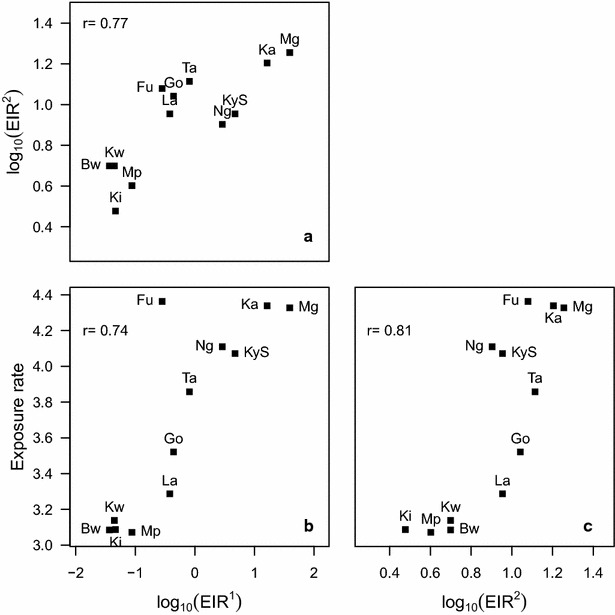
Methods: An age-specific density model which mimics antibody acquisition and loss was developed to make full use of the information provided by serological measures of antibody levels. This was fitted to blood-stage antibody density data from 12 villages at varying transmission intensity in Northern Tanzania to estimate the exposure rate as an alternative measure of transmission intensity.

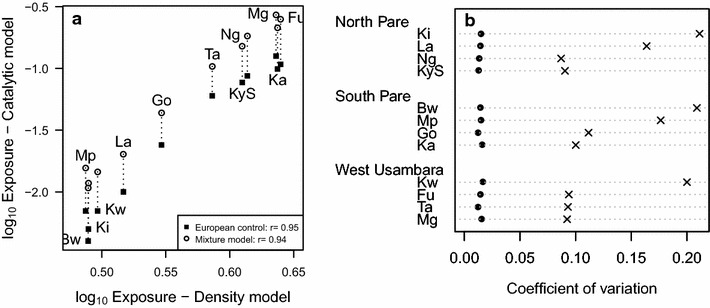
Results: The results show a high correlation between the exposure rate estimates obtained and the estimated SCR obtained from a catalytic model (r = 0.95) and with two derived measures of EIR (r = 0.74 and r = 0.81). Estimates of exposure rate obtained with the density model were also more precise than those derived from catalytic models.

Conclusion: This approach, if validated across different epidemiological settings, could be a useful alternative framework for quantifying transmission intensity, which makes more complete use of serological data.


Figures

Fig. 1
Fig. 1
Antibody levels associated with age and village altitude for MSP-119 antigens. Black dots indicate median estimates of antibody density for the actual data for each village, while median and 95 % credible intervals are represented in red for the model fit (line for median and shaded area for the credible interval). In each transect (each column), villages are presented with decreasing altitude/increasing transmission intensity from top to bottom
Fig. 2
Fig. 2
Estimated exposure rate (median ± 95 % CrI) by village. In each transect (presented by boxes) North Pare, (a), South Pare (b) and West Usambara, (c), the altitude for each village decreases from left to right and hence transmission intensity increases from left to right
Fig. 3
Fig. 3
The estimated dependence of the mean antibody boost size (δ) on the exposed individual’s current log10 antibody level. Its 95 % Credible Interval is represented by the shaded area. η denotes the antibody boost size for individual lacking current circulating antibodies (Median and 95 % CrI)
Fig. 4
Fig. 4
Comparison with seroconversion rate a Association of median estimates of exposure rates for different villages estimated using the antibody density model (x-axis) and the catalytic model (y-axis) using both European control (squares) and a mixture model to define the cut-off (circles). Note that the two measures are not equivalent but are highly correlated. b Plot of coefficient of variation (standard deviation of posterior/mean of posterior) of the exposure rate estimated from both the density model (black circles) and the catalytic model (x) using European controls. Data are presented for each village categorized by transect
Fig. 5
Fig. 5
Comparison of metrics across villages. a EIR1 (calculated from altitude) with EIR2 (calculated from parasite prevalence); b exposure rate estimated with the antibody density model with EIR1; c exposure rate estimated with the antibody density model with EIR2. Speaman’s correlation coefficientis denoted by r

References

    1. WHO . World Malaria Report 2014. Geneva: World Health Organization; 2014.
    1. Gething PW, Patil AP, Smith DL, Guerra CA, Elyazar IRF, Johnston GL, et al. A new world malaria map: Plasmodium falciparum endemicity in 2010. Malar J. 2011;10:378. doi: 10.1186/1475-2875-10-378. - DOI - PMC - PubMed
    1. Malaria Indicators Surveys [http://www.malariasurveys.org].
    1. Oduro AR, Conway DJ, Schellenberg D, Satoguina J, Greenwood BM, Bojang KA. Seroepidemiological and parasitological evaluation of the heterogeneity of malaria infection in the Gambia. Malar J. 2013;12:222. doi: 10.1186/1475-2875-12-222. - DOI - PMC - PubMed
    1. Voller A, Draper CC. Immunodiagnosis and sero-epidemiology of malaria. Br Med Bull. 1982;38:173–177. - PubMed

Publication types

Substances