Comparative Study
. 2017 Mar;33(3):193-210.
doi: 10.1177/0748233715619072. Epub 2016 Jul 9.

Combined analysis of job and task benzene air exposures among workers at four US refinery operations

Affiliations
Comparative Study

Combined analysis of job and task benzene air exposures among workers at four US refinery operations

Amanda Burns et al. Toxicol Ind Health. 2017 Mar.

Abstract

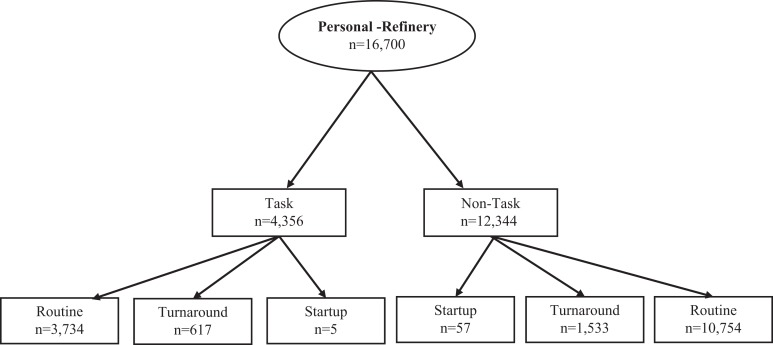
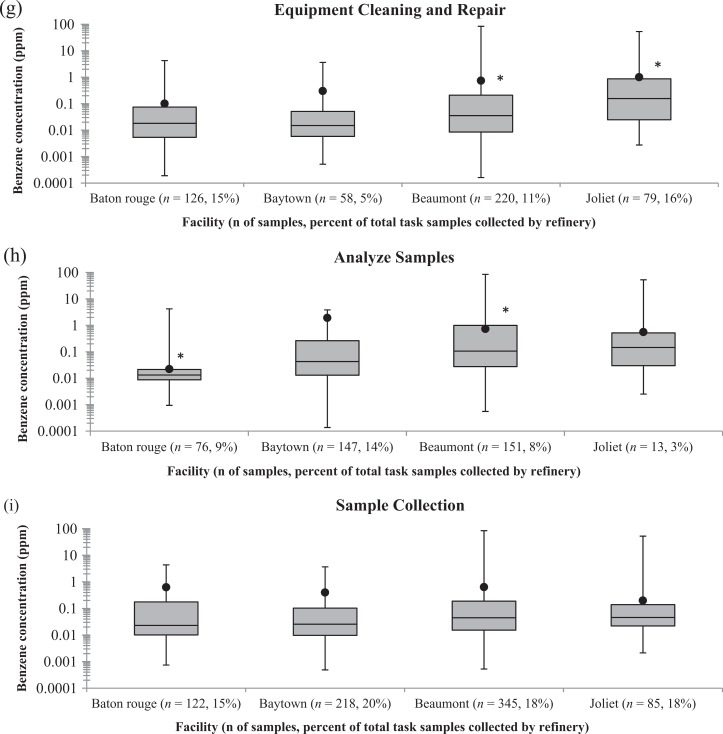
Workplace air samples analyzed for benzene at four US refineries from 1976 to 2007 were pooled into a single dataset to characterize similarities and differences between job titles, tasks and refineries, and to provide a robust dataset for exposure reconstruction. Approximately 12,000 non-task (>180 min) personal samples associated with 50 job titles and 4000 task (<180 min) samples characterizing 24 tasks were evaluated. Personal air sample data from four individual refineries were pooled based on a number of factors including (1) the consistent sampling approach used by refinery industrial hygienists over time, (2) the use of similar exposure controls, (3) the comparability of benzene content of process streams and end products, (4) the ability to assign uniform job titles and task codes across all four refineries, and (5) our analysis of variance (ANOVA) of the distribution of benzene air concentrations for select jobs/tasks across all four refineries. The jobs and tasks most frequently sampled included those with highest potential contact with refinery product streams containing benzene, which reflected the targeted sampling approach utilized by the facility industrial hygienists. Task and non-task data were analyzed to identify and account for significant differences within job-area, task-job, and task-area categories. This analysis demonstrated that in general, areas with benzene containing process streams were associated with greater benzene air concentrations compared to areas with process streams containing little to no benzene. For several job titles and tasks analyzed, there was a statistically significant decrease in benzene air concentration after 1990. This study provides a job and task-focused analysis of occupational exposure to benzene during refinery operations, and it should be useful for reconstructing refinery workers' exposures to benzene over the past 30 years.

Keywords: Benzene; exposure assessment; industrial hygiene; refineries.


Figures

Figure 1.
Figure 1.
Data Breakdown (1976-2007).
Figure 2.
Figure 2.
Distribution of Non-Task and Task Data by Refinery. Error bars represent minimum and maximum values; dot represents arithmetic mean, box represents 75th, 50th, and 25th percentile. (a) Process technician; *significant difference between Baytown and Baton Rouge/Beaumont/Joliet (p < 0.05); *significant difference between Beaumont and Joliet (p < 0.05). (b) Laboratory technician; *significant difference between Baton Rouge and Beaumont/Joliet (p < 0.05); *significant difference between Baytown and Beaumont/Joliet (p < 0.05). (c) Machinist; *significant difference between Baton Rouge and Baytown/Beaumont. (d) Pipefitter/welder; *significant difference between Joliet and Beaumont/Baton Rouge/Baytown (p < 0.05); *significant difference between Beaumont and Baytown. (e) Blinding and breaking; *significant difference between Beaumont and Baton Rouge/Baytown (p < 0.05); *significant difference between Joliet and Baton Rouge/Beaumont. (f) Gauging. (g) Equipment cleaning and repair; *significant difference between Beaumont and Baton Rouge (p < 0.05); *significant difference between Joliet and Baton Rouge/Beaumont/Baytown (p < 0.05). (h) Analyze samples; *significant difference between Baton Rouge and Baytown/Beaumont/Joliet (p < 0.05); *significant difference between Beaumont and Baytown. (i) Sample collection.
Figure 2.
Figure 2.
Distribution of Non-Task and Task Data by Refinery. Error bars represent minimum and maximum values; dot represents arithmetic mean, box represents 75th, 50th, and 25th percentile. (a) Process technician; *significant difference between Baytown and Baton Rouge/Beaumont/Joliet (p < 0.05); *significant difference between Beaumont and Joliet (p < 0.05). (b) Laboratory technician; *significant difference between Baton Rouge and Beaumont/Joliet (p < 0.05); *significant difference between Baytown and Beaumont/Joliet (p < 0.05). (c) Machinist; *significant difference between Baton Rouge and Baytown/Beaumont. (d) Pipefitter/welder; *significant difference between Joliet and Beaumont/Baton Rouge/Baytown (p < 0.05); *significant difference between Beaumont and Baytown. (e) Blinding and breaking; *significant difference between Beaumont and Baton Rouge/Baytown (p < 0.05); *significant difference between Joliet and Baton Rouge/Beaumont. (f) Gauging. (g) Equipment cleaning and repair; *significant difference between Beaumont and Baton Rouge (p < 0.05); *significant difference between Joliet and Baton Rouge/Beaumont/Baytown (p < 0.05). (h) Analyze samples; *significant difference between Baton Rouge and Baytown/Beaumont/Joliet (p < 0.05); *significant difference between Beaumont and Baytown. (i) Sample collection.
Figure 3.
Figure 3.
(a) Distribution of non-task benzene air concentrations by job category and time. PT: process technician; Mach: machinist; LT: laboratory technician; PF: pipefitter/welder; HDF: hydrofiner; WT: waste treatment; RF: reformer; AO: all other areas; TA: turnaround status. Concentrations for the job titles shown were significantly different by time period (p < 0.05). (b) Distribution of task benzene air concentration by task bin and time. Concentrations for the tasks shown were significantly different by time period (p < 0.05).

References

    1. Armstrong TW, Pearlman ED, Schnatter AR, et al. (1996) Retrospective benzene and total hydrocarbon exposure assessment for a petroleum marketing and distribution worker epidemiology study. American Industrial Hygiene Association Journal 57: 333–343. - PubMed
    1. Baccarelli A, Pfeiffer R, Consonni D, et al. (2005) Handling of dioxin measurement data in the presence of non-detectable values: overview of available methods and their application in Seveso chloracne study. Chemosphere 60: 898–906. - PubMed
    1. Buchet JP, Van Eyken J, Lauwerys R. (1984) The evaluation of the exposure of benzene for the workers that are related to or in charge of the oil refinery (original in French). Cahiers de Medecine de Travail Cahiers Voor Arberdsgeneeskunde 21: 25–27.
    1. CONCAWE (1987) A Survey of Exposures to Gasoline Vapour. The Hague: Oil Companies European Organization for Environment, Health and Safety (CONCAWE; ).
    1. CONCAWE (1994) Review of European Oil Industry Benzene Exposure Data (1986-1992). Brussels: Oil Companies European Organization for Environment, Health and Safety (CONCAWE; ).

MeSH terms

LinkOut - more resources