. 2016 Mar 22;113(12):E1673-82.
doi: 10.1073/pnas.1519650113. Epub 2016 Feb 9.

Circadian control of oscillations in mitochondrial rate-limiting enzymes and nutrient utilization by PERIOD proteins

Affiliations

Circadian control of oscillations in mitochondrial rate-limiting enzymes and nutrient utilization by PERIOD proteins

Adi Neufeld-Cohen et al. Proc Natl Acad Sci U S A. .

Abstract

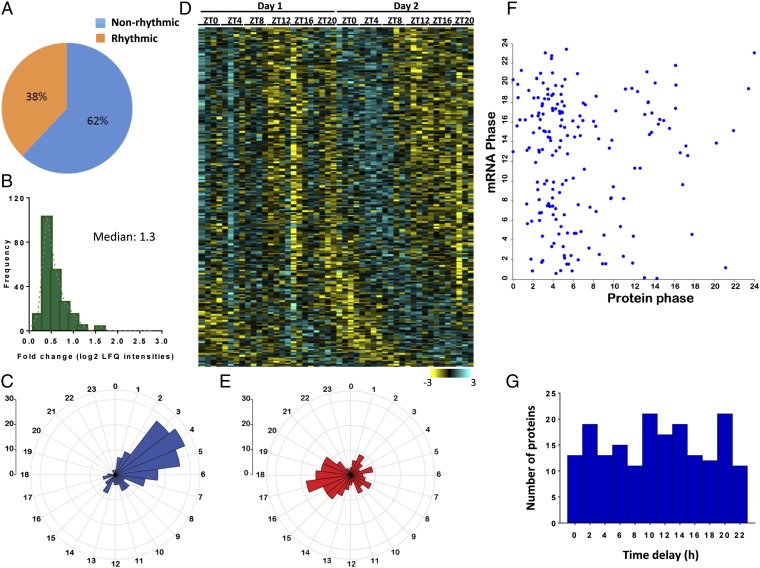
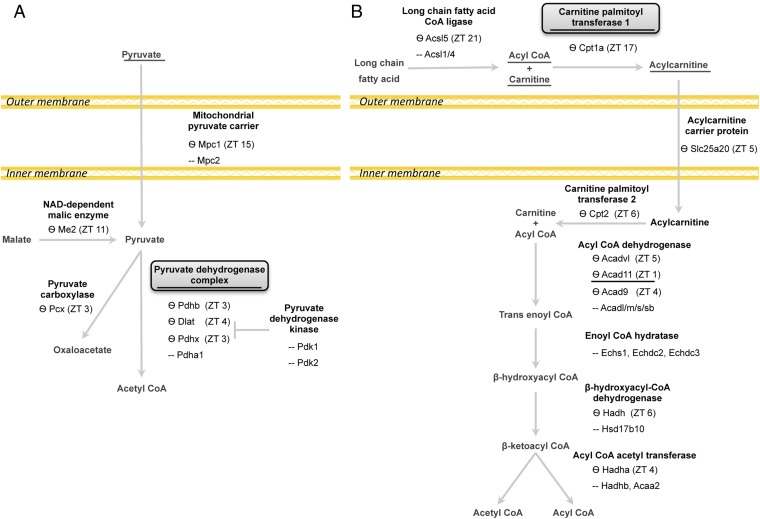
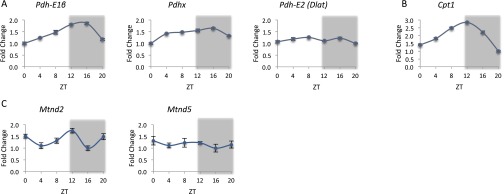
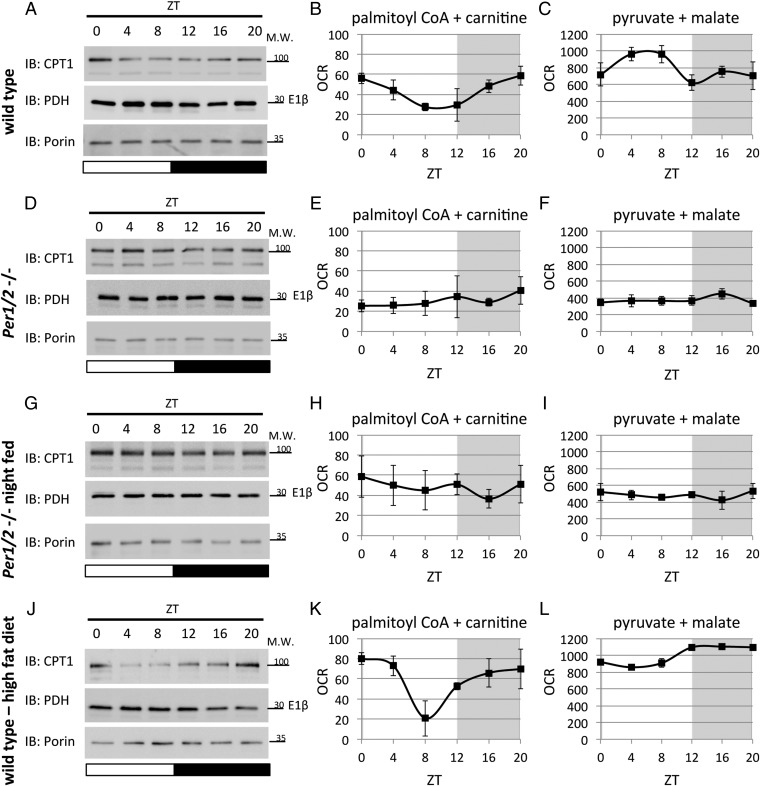
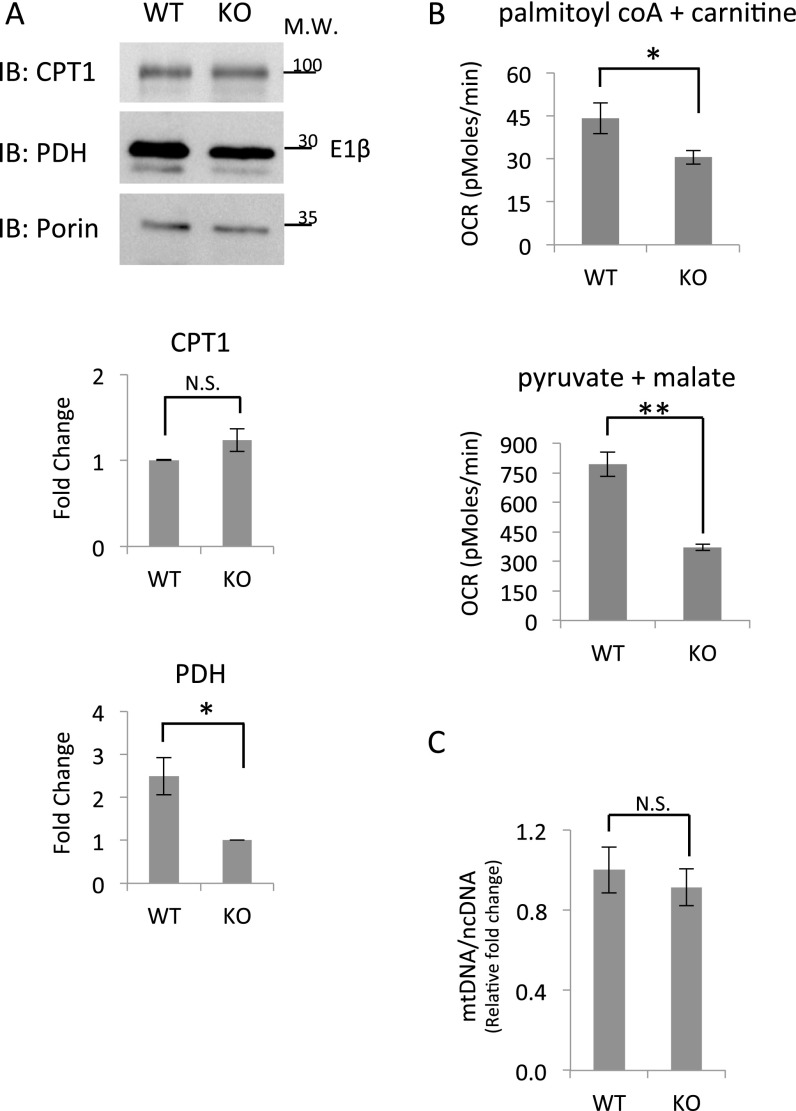
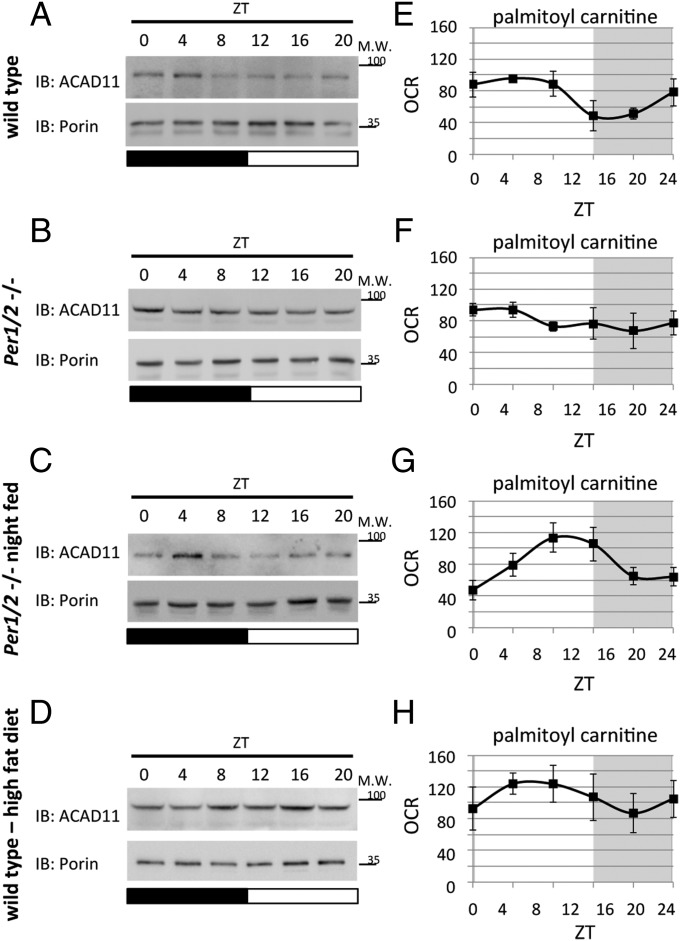
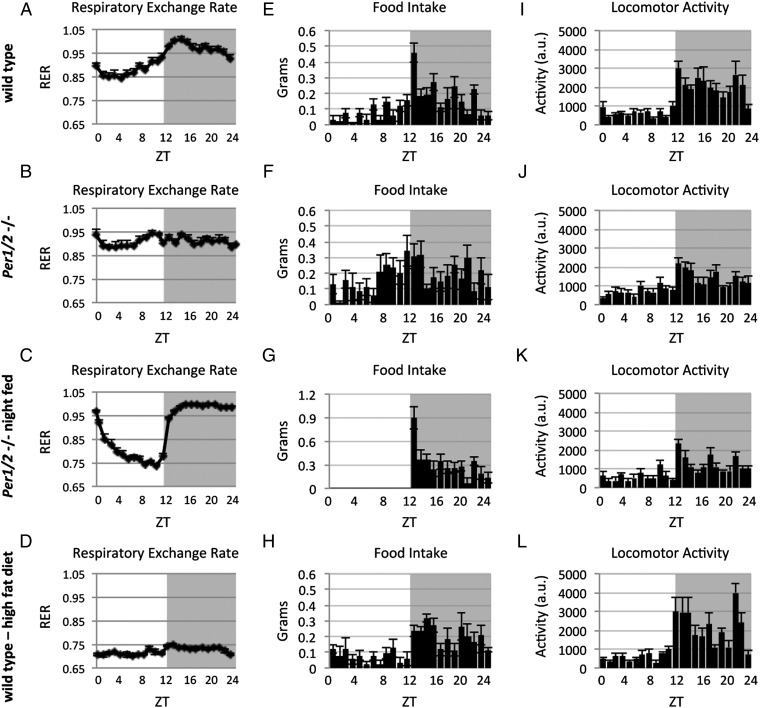
Mitochondria are major suppliers of cellular energy through nutrients oxidation. Little is known about the mechanisms that enable mitochondria to cope with changes in nutrient supply and energy demand that naturally occur throughout the day. To address this question, we applied MS-based quantitative proteomics on isolated mitochondria from mice killed throughout the day and identified extensive oscillations in the mitochondrial proteome. Remarkably, the majority of cycling mitochondrial proteins peaked during the early light phase. We found that rate-limiting mitochondrial enzymes that process lipids and carbohydrates accumulate in a diurnal manner and are dependent on the clock proteins PER1/2. In this conjuncture, we uncovered daily oscillations in mitochondrial respiration that peak during different times of the day in response to different nutrients. Notably, the diurnal regulation of mitochondrial respiration was blunted in mice lacking PER1/2 or on a high-fat diet. We propose that PERIOD proteins optimize mitochondrial metabolism to daily changes in energy supply/demand and thereby, serve as a rheostat for mitochondrial nutrient utilization.

Keywords: PERIOD proteins; circadian rhythm; metabolism; mitochondria; proteomics.


Conflict of interest statement

The authors declare no conflict of interest.

Figures

Fig. 1.
Fig. 1.
Daily oscillations in the mitochondrial proteome. (A) The percentage of annotated mitochondrial proteins that exhibit a diurnal pattern of accumulation. Of 590 quantified and annotated as mitochondrial proteins, 223 proteins exhibited a diurnal pattern of accumulation (38%; 12 time points; n = 4 for each; q value < 0.15). (B) Fold change of rhythmic proteins annotated as mitochondria calculated using the median of the log2 label-free (LFQ) intensities for each time point. The median fold change of the population was 1.3-fold. (C) Phases distribution of the rhythmic proteins annotated as mitochondrial proteins (223 proteins). The y axis on the upper left side indicates the scale of the histogram bins. (D) Hierarchical clustering of rhythmic proteins annotated as mitochondria based on the phase of their maximal expression. Each row corresponds to a protein group entry, and each column indicates the intensities for all of the biological replicates at each time point. The color scale of the intensity values (Z-scored normalized log2 intensities) is shown in the bottom bar [high (light blue) and low (yellow)]. (E) Phase distribution of rhythmic transcripts corresponding to the cycling mitochondrial proteins (185 transcripts). The y axis on the upper left side indicates the scale of the histogram bins. (F) Scatter plot showing the phases for every cycling mitochondrial protein and its corresponding rhythmic mRNA (Pearson correlation r = 0.01). (G) Distribution of the time delays between the peak of the cycling protein and the peak of the corresponding oscillating mRNA.
Fig. S1.
Fig. S1.
Analysis of diurnal protein oscillations in the mitochondrial fraction. (A) Scatter plot showing protein categories (UniProt keywords) that were statistically enriched (Fisher exact test P < 0.05) in the quantified mitochondrial fraction proteome compared with an in silico mouse proteome. Highlighted categories are the most statistically enriched. Categories statistically overrepresented (enrichment factor >1) are indicated in red, and categories statistically underrepresented (enrichment factor <1) are indicated in blue. (B) The percentage of proteins that exhibit a daily pattern of accumulation in the mitochondrial fraction prepared from mouse liver. Of 1,537 identified and quantified proteins, 452 exhibited statistically significant (q value < 0.15) daily oscillations (29%; 12 time points; n = 4 for each). (C) Fold change distribution of rhythmic proteins calculated using the median of the log2 label-free (LFQ) intensities for each time point. The median fold change of the population was 1.41-fold. (D) Radar plot shows the distribution of phases for rhythmic proteins. The y axis on the upper left side indicates the scale of the histogram bins. (E) Hierarchical clustering of rhythmic proteins based on the phase of the cycle. Each row corresponds to a protein group, and each column corresponds to the analyzed sample. The color scale of the values (Z-scored normalized log2 label-free intensities) is shown in the bottom bar [high (light blue) and low (yellow)].
Fig. S2.
Fig. S2.
Cycling mitochondrial proteins involved in key processes show high abundance during the light phase. Scatter plot showing the result of cycling annotation distribution using UniProt keywords as protein categories. The indicated categories show statistically significant (FDR < 0.1) enrichment in a phase-dependent manner for the mitochondrial-annotated dataset. Phase (ZT) is indicated in the x axis, and the P value (−log10) of the statistical analysis is indicated in the y axis.
Fig. 2.
Fig. 2.
Diurnal oscillations of enzymes in pyruvate metabolism and fatty acid uptake and oxidation. Schematic depiction of the following principal mitochondrial pathways: (A) pyruvate metabolism and (B) fatty acid uptake and FAO. Metabolites are marked in gray, and enzymes are in black; known rate-limiting enzymes are shown as squares. Oscillating enzymes according to the proteomics analysis are marked with a wave sign (Ѳ) together with their peak time indicated by ZT. Metabolites used as substrates for mitochondrial respiration assays in Figs. 4 and 5 and relevant enzymes are underlined.
Fig. 3.
Fig. 3.
Diurnal oscillations of enzymes in the Krebs cycle and the respiratory chain. Schematic depiction of the following principal mitochondrial pathways: (A) Krebs cycle and (B) respiratory chain complexes. Metabolites are marked in gray, and enzymes are in black. Oscillating enzymes according to the proteomics analysis are marked with a wave sign (Ѳ) together with their peak time indicated by ZT.
Fig. S3.
Fig. S3.
Daily expression profiles of enzymes participating in mitochondrial nutrient processing. WT mice fed ad libitum were killed at 4-h intervals throughout the day. Total RNA was prepared from liver, and mRNA expression levels of enzymes participating in mitochondrial nutrient processing were determined by quantitative real-time PCR and presented as fold change relative to the lowest value, with means ± SDs of four mice per time point. (A) Pdh-E1β, Pdhx, and Pdh-E2 (Dlat). (B) Cpt1. (C) Mtnd2 and Mtnd5. Gray shading represents the dark phase.
Fig. 4.
Fig. 4.
Daily oscillations in accumulation of rate-limiting mitochondrial enzymes and mitochondrial respiration are PER1/2-dependent. (A) Mitochondrial protein extracts of WT mice fed ad libitum were analyzed by SDS/PAGE and immunoblot (IB) with indicated antibodies. Oxygen consumption rates (OCRs) of isolated mitochondria prepared from WT mice fed ad libitum were quantified using the Seahorse Flux Analyzer in the presence of the indicated substrates: (B) palmitoyl CoA and carnitine and (C) pyruvate and malate. (D) Mitochondrial protein extracts of PER1/2 null mice fed ad libitum were analyzed by SDS/PAGE and IB. OCRs of isolated mitochondria prepared from PER1/2 null mice fed ad libitum were quantified in the presence of the indicated substrates: (E) palmitoyl CoA and carnitine and (F) pyruvate and malate. (G) Mitochondrial protein extracts of night-fed PER1/2 null mice were analyzed by SDS/PAGE and IB. OCRs of isolated mitochondria prepared from night-fed PER1/2 null mice were quantified in the presence of the indicated substrates: (H) palmitoyl CoA and carnitine and (I) pyruvate and malate. (J) Mitochondrial protein extracts of WT mice fed with a high-fat diet for 3 d were analyzed by SDS/PAGE and IB. OCRs of isolated mitochondria prepared from WT mice fed with a high-fat diet for 3 d were quantified in the presence of the indicated substrates: (K) palmitoyl CoA and carnitine and (L) pyruvate and malate. Carbonilcyanide p-trifluoromethoxyphenylhydrazone (FCCP) was specifically added in the case of pyruvate and malate according to standard protocols as detailed in Materials and Methods. For SDS/PAGE and IB, porin levels were used as a loading control, and each time point consists of a mix of mitochondria isolated from three to four individual mice (Fig. S4 shows quantification of the different IBs). OCR measurements are presented in picomoles per minute as means ± SEMs, with individual measurements of three to five animals per time point. Gray shading represents the dark phase. Molecular mass (M.W.) is indicated in kilodaltons.
Fig. S4.
Fig. S4.
Immunoblot quantifications of CPT1, PDH, and ACAD11 protein levels. Quantifications of CPT1, PDH-E1β, and ACAD11 relative to porin levels from three to four independent experiments; each comprises of a single mouse per time point at six time points throughout the day. (A) WT mice fed ad libitum. (B) PER1/2 null mice fed ad libitum. (C) Night-fed PER1/2 null mice. (D) WT mice fed with a high-fat diet for 3 d. Data are presented as fold change relative to the lowest value, with means ± SEMs of three to four different immunoblots. *P value < 0.05; **P value < 0.01; ***P value < 0.001.
Fig. S5.
Fig. S5.
Mitochondrial respiration of isolated mitochondria from synchronized NIH 3T3 throughout the circadian cycle. NIH 3T3 cells were synchronized with a Dexamethasone (Dex) shock as previously described (27) and harvested at 4-h intervals from 24 to 44 h after the Dex shock. (A) Total RNA was prepared, and mRNA expression levels of Bmal1 and Per2 were determined by quantitative real-time PCR. Data are presented as relative expressions, with means ± SEMs of three independent experiments. (B) Mitochondria were isolated from NIH 3T3 cells as described in Materials and Methods. Oxygen consumption rates (OCRs) of isolated mitochondria were quantified using the Seahorse Flux Analyzer in the presence of palmitoyl CoA and carnitine or pyruvate and malate as indicated. OCR measurements are presented in picomoles per minute as means ± SEMs of thee independent experiments.
Fig. S6.
Fig. S6.
Comparison of daily mean CPT1 and PDH protein levels, mitochondrial respiration, and the number of mitochondria in WT and Per1/2−/− mice. (A) Mitochondrial protein extracts of WT and Per1/2−/− mice (KO) fed ad libitum were analyzed by SDS/PAGE and immunoblot (IB) with indicated antibodies. Porin levels were used as a loading control, and each condition consists of a mixture of all six time points throughout the day, with mitochondria isolated from three to four individual mice for each time point. CPT1 and PDH-E1β levels were quantified relative to porin levels. Data are presented as fold change relative to the lowest value, with means ± SEMs of three independent experiments. (B) Oxygen consumption rates (OCRs) of isolated mitochondria from WT and Per1/2−/− mice (KO) fed ad libitum were measured in the presence of palmitoyl CoA and carnitine or pyruvate and malate. Carbonilcyanide p-trifluoromethoxyphenylhydrazone (FCCP) was added in the case of pyruvate and malate according to standard protocols as detailed in Materials and Methods. For each condition, data are presented in picomoles per minute as means ± SEMs of all six time points throughout the day, with three to four individual mice for each time point. (C) The average ratio of mtDNA to nuclear DNA (ncDNA) in WT and Per1/2−/− mice (KO) fed ad libitum was quantified by real-time PCR as described in Materials and Methods. Data are presented as fold change relative to the highest value, with means ± SEMs of n = 4. Molecular mass (M.W.) is indicated in kilodaltons. N.S., nonsignificant. *P value < 0.05; **P value < 0.001.
Fig. 5.
Fig. 5.
Analysis of FAO in WT and PER1/2 null mice under different feeding regimens. Mitochondrial protein extracts were analyzed by SDS/PAGE and immunoblot (IB) with indicated antibodies. (A) WT mice fed ad libitum. (B) PER1/2 null mice fed ad libitum. (C) Night-fed PER1/2 null mice. (D) WT mice fed with a high-fat diet for 3 d. Oxygen consumption rates (OCRs) of isolated mitochondria in the presence of palmitoyl carnitine and malate were quantified using the Seahorse Flux Analyzer. (E) WT mice fed ad libitum. (F) PER1/2 null mice fed ad libitum. (G) Night-fed PER1/2 null mice. (H) WT mice fed with a high-fat diet for 3 d. For SDS/PAGE and IB, porin levels were used as a loading control, and each time point consists of a mix of mitochondria isolated from three to five individual mice (Fig. S4 shows quantification of the different IBs). OCR measurements are presented in picomoles per minute as means ± SEMs, with individual measurements of three to five animals per time point. Gray shading represents the dark phase. Molecular mass (M.W.) is indicated in kilodaltons.
Fig. 6.
Fig. 6.
Analysis of RER, feeding behavior, and locomotor activity of WT and PER1/2 null mice under different feeding regimens. RER, food consumption, and voluntary locomotor activity were recorded using metabolic cages. (A) RER of WT mice fed ad libitum. (B) RER of PER1/2 null mice fed ad libitum. (C) RER of night-fed PER1/2 null mice. (D) RER of WT mice fed with a high-fat diet for 3 d. (E) Food consumption of WT mice fed ad libitum (29.3% and 70.7% during the light and dark phases, respectively; n = 7; P value = 1E-05). (F) Food consumption of PER1/2 null mice fed ad libitum (44.8% and 55.2% during the light and dark phases, respectively; n = 8; P value = 0.01). (G) Food consumption of night-fed PER1/2 null mice. (H) Food consumption of WT mice fed with a high-fat diet for 3 d (26.7% and 73.3% during the light and dark phases, respectively; n = 4; P value = 6E-06). (I) Locomotor activity of WT mice fed ad libitum (23.6% and 76.4% during the light and dark phases, respectively; n = 7; P value = 1E-07). (J) Locomotor activity of PER1/2 null mice fed ad libitum (33.1% and 66.9% during the light and dark phases, respectively; n = 8; P value = 7E-05). (K) Locomotor activity of night-fed PER1/2 null mice (31% and 69% during the light and dark phases, respectively; n = 8; P value = 2E-04). (L) Locomotor activity of WT mice fed with a high-fat diet for 3 d (22.7% and 77.3% during the light and dark phases, respectively; n = 4; P value = 1E-04). Data are presented as means ± SEMs, with individual measurements of four to eight animals per time point. Locomotor activity is presented in arbitrary units (a.u.). Gray shading represents the dark phase.

Comment in

References

    1. Liesa M, Shirihai OS. Mitochondrial dynamics in the regulation of nutrient utilization and energy expenditure. Cell Metab. 2013;17(4):491–506. - PMC - PubMed
    1. Nunnari J, Suomalainen A. Mitochondria: In sickness and in health. Cell. 2012;148(6):1145–1159. - PMC - PubMed
    1. Asher G, Schibler U. Crosstalk between components of circadian and metabolic cycles in mammals. Cell Metab. 2011;13(2):125–137. - PubMed
    1. Bass J. Circadian topology of metabolism. Nature. 2012;491(7424):348–356. - PubMed
    1. Green CB, Takahashi JS, Bass J. The meter of metabolism. Cell. 2008;134(5):728–742. - PMC - PubMed

Publication types

MeSH terms