. 2016 Feb 9;6(2):168-75.
doi: 10.1016/j.stemcr.2016.01.003.

Epigenetic Classification of Human Mesenchymal Stromal Cells

Affiliations

Epigenetic Classification of Human Mesenchymal Stromal Cells

Danilo Candido de Almeida et al. Stem Cell Reports. .

Abstract

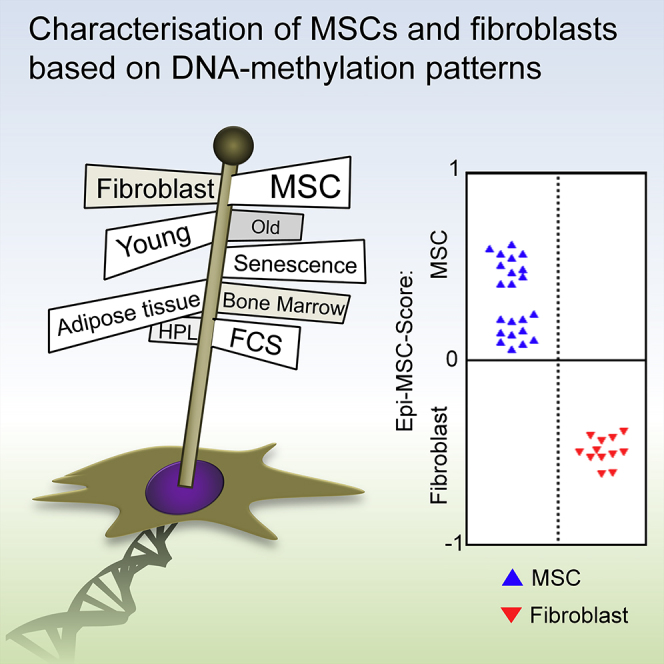
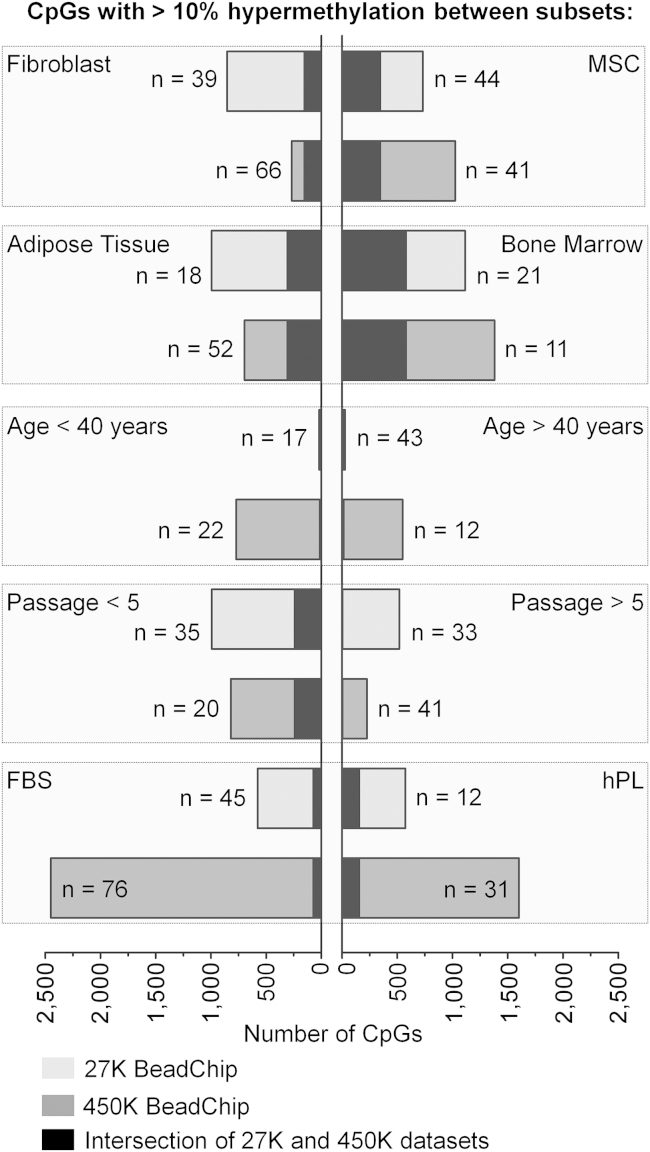
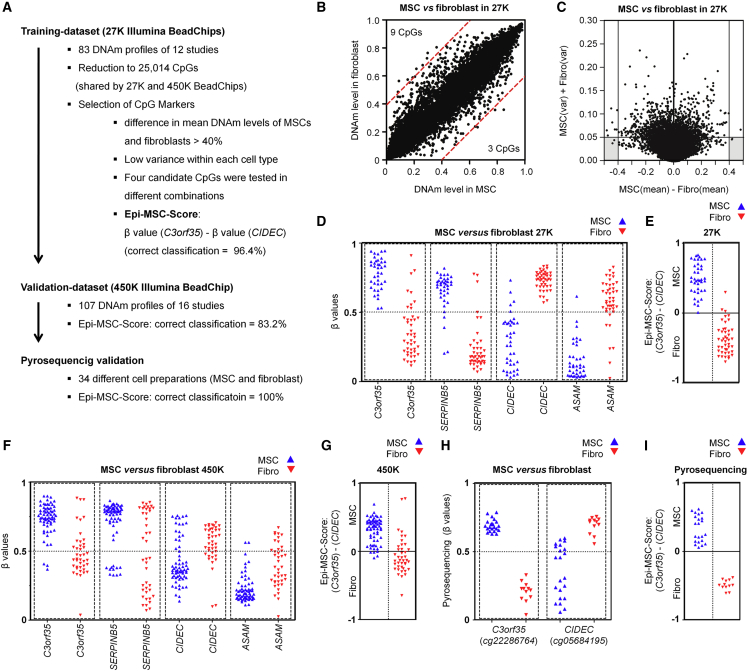
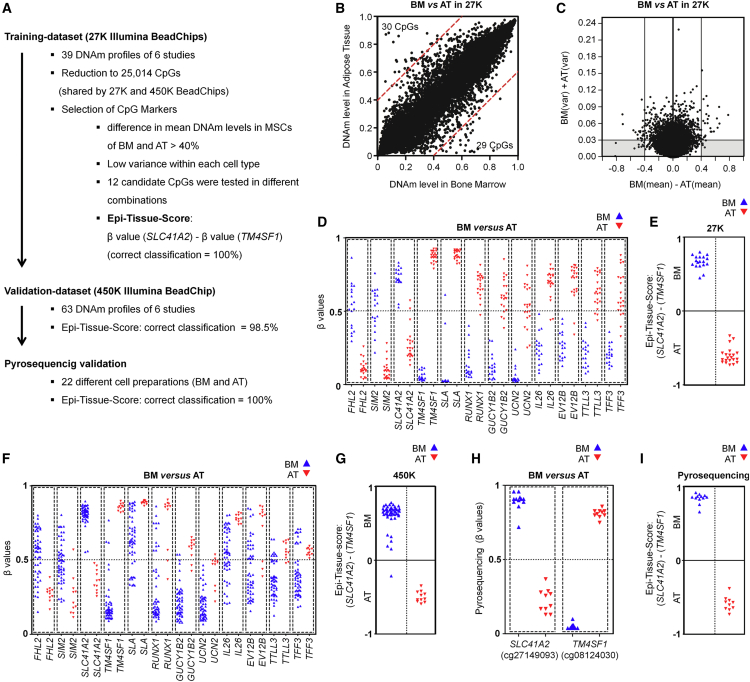
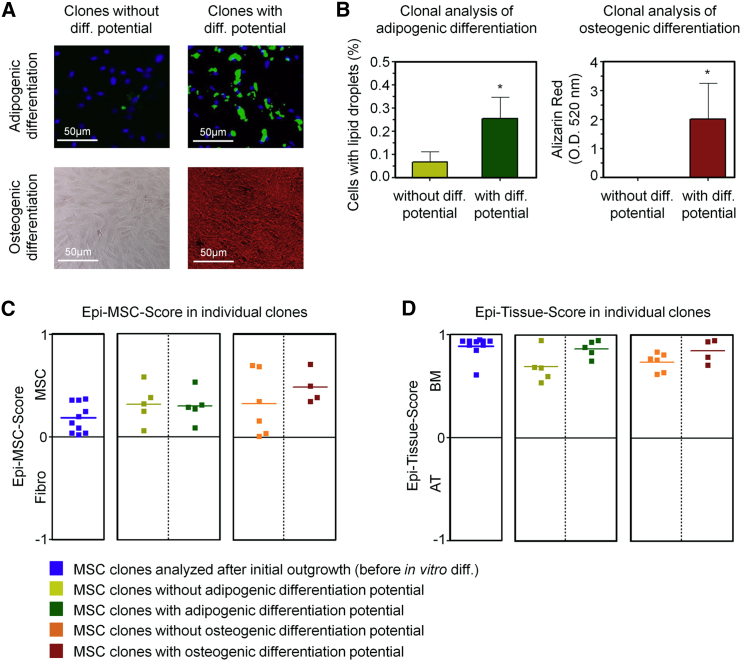
Standardization of mesenchymal stromal cells (MSCs) is hampered by the lack of a precise definition for these cell preparations; for example, there are no molecular markers to discern MSCs and fibroblasts. In this study, we followed the hypothesis that specific DNA methylation (DNAm) patterns can assist classification of MSCs. We utilized 190 DNAm profiles to address the impact of tissue of origin, donor age, replicative senescence, and serum supplements on the epigenetic makeup. Based on this, we elaborated a simple epigenetic signature based on two CpG sites to classify MSCs and fibroblasts, referred to as the Epi-MSC-Score. Another two-CpG signature can distinguish between MSCs from bone marrow and adipose tissue, referred to as the Epi-Tissue-Score. These assays were validated by site-specific pyrosequencing analysis in 34 primary cell preparations. Furthermore, even individual subclones of MSCs were correctly classified by our epigenetic signatures. In summary, we propose an alternative concept to use DNAm patterns for molecular definition of cell preparations, and our epigenetic scores facilitate robust and cost-effective quality control of MSC cultures.

Keywords: DNA methylation; adipose tissue; bone marrow; epigenetic score; fibroblast; mesenchymal stem cell; mesenchymal stromal cell.


Figures

None
Graphical abstract
Figure 1
Figure 1
Differentially Methylated CpGs in Pairwise Comparisons DNA methylation profiles (generated on Illumina HumanMethylation BeadChips 27K or 450K) were stratified by cell type (MSCs versus fibroblasts), tissue source (here particularly MSCs from bone marrow versus adipose tissue), passage (P5), age (<40 or >40 years), and serum supplements in culture media (human platelet lysate [hPL] versus fetal calf/bovine serum [FBS]). The number of DNAm profiles per group is indicated (n) as well as the number of significant CpGs (adjusted limma t test: p < 0.05 and >10% difference in mean DNAm). Overlapping CpGs in the 27K and 450K datasets are indicated by black bars.
Figure 2
Figure 2
Epigenetic Classification of MSCs and Fibroblasts (A) Schematic overview of the experimental design that led to the Epi-MSC-Score. (B) Scatterplot of mean DNAm levels of MSCs and fibroblasts in the training dataset (CpGs with more than 40% difference are indicated by red lines). (C) Differential DNAm levels were plotted against the sum of variances within MSCs and fibroblasts. (D) DNAm levels (β values) of four CpGs that have been selected from the training datasets (27K BeadChips). (E) Classification of the training dataset by the Epi-MSC-Score. This score represents the difference of β values at cg22286764 (C3orf35) and cg05684195 (CIDEC). (F) DNAm levels of the four selected CpGs in the validation dataset (450K BeadChips; in analogy to Figure 2D). (G) Classification of the validation dataset by the Epi-MSC-Score. (H) Pyrosequencing analysis of DNAm at the two CpGs corresponding to the Epi-MSC-Score in 34 different cell preparations. (I) Classification of pyrosequencing results by the Epi-MSC-Score based on CpG in C3orf35 and CIDEC as indicated.
Figure 3
Figure 3
Classification of MSCs from Bone Marrow and Adipose Tissue (A) Schematic overview of experimental design that led to the Epi-Tissue-Score. (B) Scatterplot of mean DNAm levels in MSCs from bone marrow (BM) versus MSCs from adipose tissue (AT) in the training set (27K BeadChips; CpGs with more than 40% difference are indicated by red lines). (C) Differential DNAm levels were plotted against the sum of variances within MSCs derived from either BM or AT. (D) β Values (DNAm levels) of 12 CpGs that were selected by these criteria. (E) Classification of the training dataset by the Epi-Tissue-Score. This score represents the difference of β values at cg27149093 (SLC41A2) and cg08124030 (TM4SF1). (F) DNAm levels of the 12 selected CpGs in the validation dataset (450K BeadChips; in analogy to Figure 3D). (G) Classification of the validation dataset by the Epi-Tissue-Score. (H) Pyrosequencing analysis of DNAm at the two CpGs corresponding to the Epi-Tissue-Score in 22 MSC samples from BM and AT. (I) Classification of pyrosequencing results by the Epi-Tissue-Score based on CpG in SLC41A2 and TM4SF1 as indicated.
Figure 4
Figure 4
Analysis of Epigenetic Scores in Subclones of MSCs (A) Bone marrow-derived MSCs were subcloned and differentiated toward adipogenic or osteogenic lineages (stained with BODIPY/DAPI or Alizarin red, respectively). Representative images of clones with low or high differentiation potential are shown. (B) The in vitro differentiation potential toward adipogenic and osteogenic lineages was determined based on the percentage of cells with fat droplets or absorbance of Alizarin staining, respectively. For subsequent pyrosequencing analysis, we selected five clones that revealed either higher or lower differentiation (Student's t test; p < 0.05; error bars represent the SD). (C and D) Classification of MSC clones based on pyrosequencing results by Epi-MSC-Score (C) and Epi-Tissue-Score (D).

References

    1. Bae S., Ahn J.H., Park C.W., Son H.K., Kim K.S., Lim N.K., Jeon C.J., Kim H. Gene and microRNA expression signatures of human mesenchymal stromal cells in comparison to fibroblasts. Cell Tissue Res. 2009;335:565–573. - PubMed
    1. Bortolotti F., Ukovich L., Razban V., Martinelli V., Ruozi G., Pelos B., Dore F., Giacca M., Zacchigna S. In vivo therapeutic potential of mesenchymal stromal cells depends on the source and the isolation procedure. Stem Cell Rep. 2015;4:332–339. - PMC - PubMed
    1. Buhring H.J., Battula V.L., Treml S., Schewe B., Kanz L., Vogel W. Novel markers for the prospective isolation of human MSC. Ann. N. Y. Acad. Sci. 2007;1106:262–271. - PubMed
    1. Cai J., Miao X., Li Y., Smith C., Tsang K., Cheng L., Wang Q.F. Whole-genome sequencing identifies genetic variances in culture-expanded human mesenchymal stem cells. Stem Cell Rep. 2014;3:227–233. - PMC - PubMed
    1. Crisan M., Yap S., Casteilla L., Chen C.W., Corselli M., Park T.S., Andriolo G., Sun B., Zheng B., Zhang L. A perivascular origin for mesenchymal stem cells in multiple human organs. Cell Stem Cell. 2008;3:301–313. - PubMed

Publication types

MeSH terms