

Strong Selection at MHC in Mexicans since Admixture
- PMID: 26863142
- PMCID: PMC4749250
- DOI: 10.1371/journal.pgen.1005847
Strong Selection at MHC in Mexicans since Admixture
Erratum in
-
Correction: Strong Selection at MHC in Mexicans since Admixture.PLoS Genet. 2016 Apr 1;12(4):e1005983. doi: 10.1371/journal.pgen.1005983. eCollection 2016 Apr. PLoS Genet. 2016. PMID: 27035344 Free PMC article. No abstract available.
Abstract
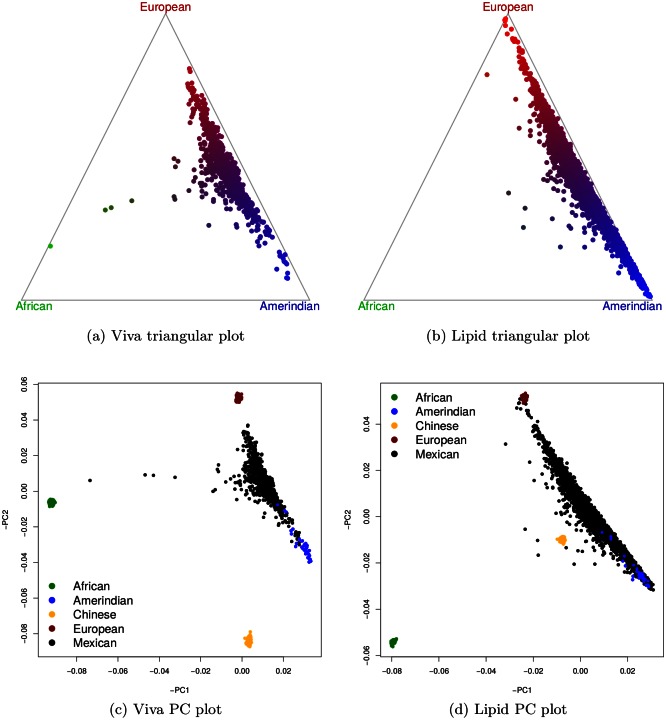
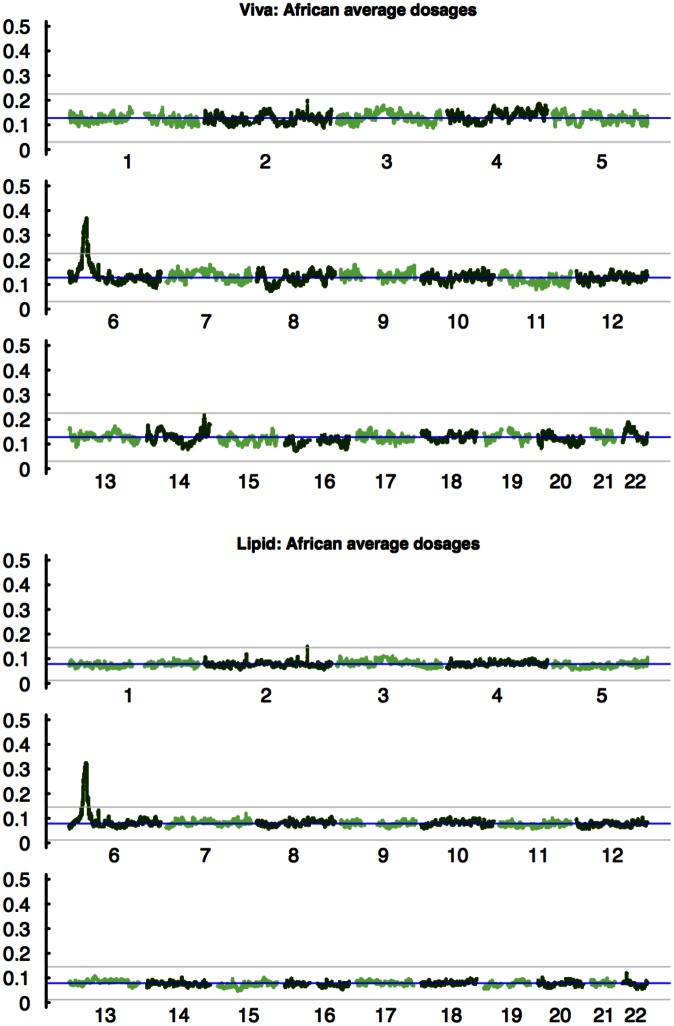
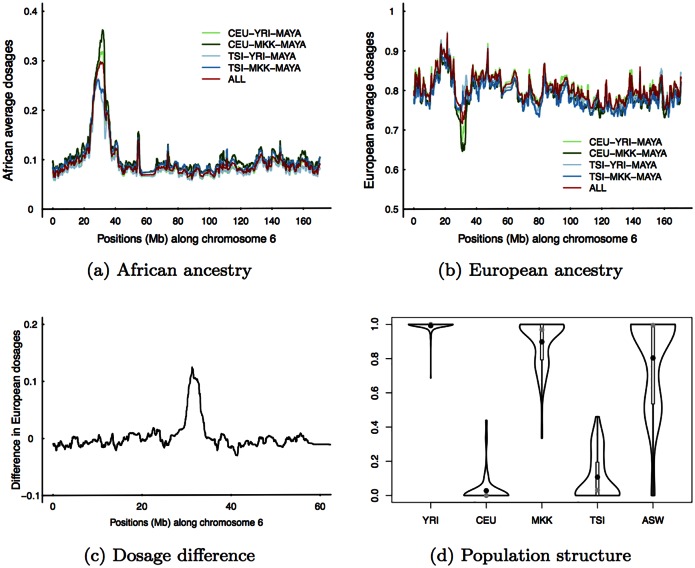
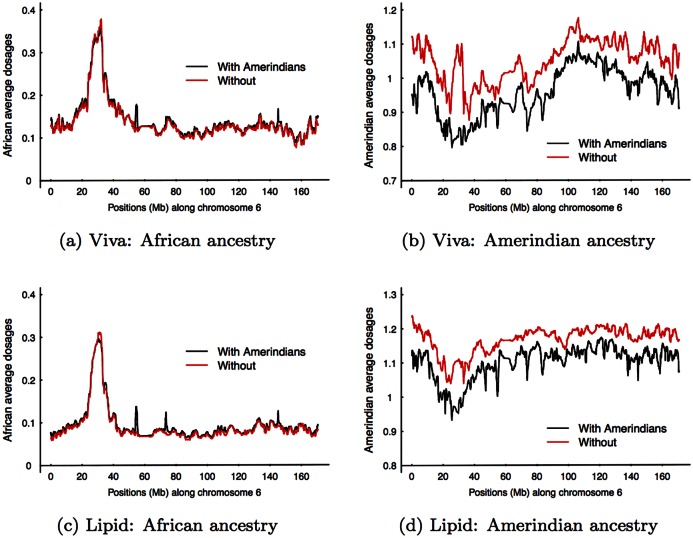
Mexicans are a recent admixture of Amerindians, Europeans, and Africans. We performed local ancestry analysis of Mexican samples from two genome-wide association studies obtained from dbGaP, and discovered that at the MHC region Mexicans have excessive African ancestral alleles compared to the rest of the genome, which is the hallmark of recent selection for admixed samples. The estimated selection coefficients are 0.05 and 0.07 for two datasets, which put our finding among the strongest known selections observed in humans, namely, lactase selection in northern Europeans and sickle-cell trait in Africans. Using inaccurate Amerindian training samples was a major concern for the credibility of previously reported selection signals in Latinos. Taking advantage of the flexibility of our statistical model, we devised a model fitting technique that can learn Amerindian ancestral haplotype from the admixed samples, which allows us to infer local ancestries for Mexicans using only European and African training samples. The strong selection signal at the MHC remains without Amerindian training samples. Finally, we note that medical history studies suggest such a strong selection at MHC is plausible in Mexicans.
Conflict of interest statement
The authors have declared that no competing interests exist.
Figures
References
-
- Diamond J. Guns, Germs, and Steel: The Fates of Human Societies. W.W. Norton and Company; 1997.
-
- González Burchard E, Borrell LN, Choudhry S, Naqvi M, Tsai HJ, Rodriguez-Santana JR, et al. Latino Populations: A Unique Opportunity for the Study of Race, Genetics, and Social Environment in Epidemiological Research. American Journal of Public Health. 2005. 12;95(12):2161–2168. Available from: http://www.ncbi.nlm.nih.gov/pmc/articles/PMC1449501/. 10.2105/AJPH.2005.068668 - DOI - PMC - PubMed
-
- Tang H, Choudhry S, Mei R, Morgan M, Rodriguez-Cintron W, Burchard EG, et al. Recent Genetic Selection in the Ancestral Admixture of Puerto Ricans. American Journal of Human Genetics. 2007. 09;81(3):626–633. Available from: http://www.ncbi.nlm.nih.gov/pmc/articles/PMC1950843/. 10.1086/520769 - DOI - PMC - PubMed
-
- Tang H, Coram M, Wang P, Zhu X, Risch N. Reconstructing Genetic Ancestry Blocks in Admixed Individuals. American Journal of Human Genetics. 2006. 07;79(1):1–12. Available from: http://www.ncbi.nlm.nih.gov/pmc/articles/PMC1474129/. 10.1086/504302 - DOI - PMC - PubMed
-
- Price AL, Weale ME, Patterson N, Myers SR, Need AC, Shianna KV, et al. Long-Range LD Can Confound Genome Scans in Admixed Populations. American Journal of Human Genetics. 2008. 07;83(1):132–135. Available from: http://www.ncbi.nlm.nih.gov/pmc/articles/PMC2443852/. 10.1016/j.ajhg.2008.06.005 - DOI - PMC - PubMed
Publication types
MeSH terms
Grants and funding
LinkOut - more resources
Full Text Sources
Other Literature Sources
Research Materials
