. 2016;33(2):111-22.
doi: 10.14573/altex.1510054. Epub 2016 Feb 11.

Analysis of public oral toxicity data from REACH registrations 2008-2014

Affiliations

Analysis of public oral toxicity data from REACH registrations 2008-2014

Thomas Luechtefeld et al. ALTEX. 2016.

Abstract

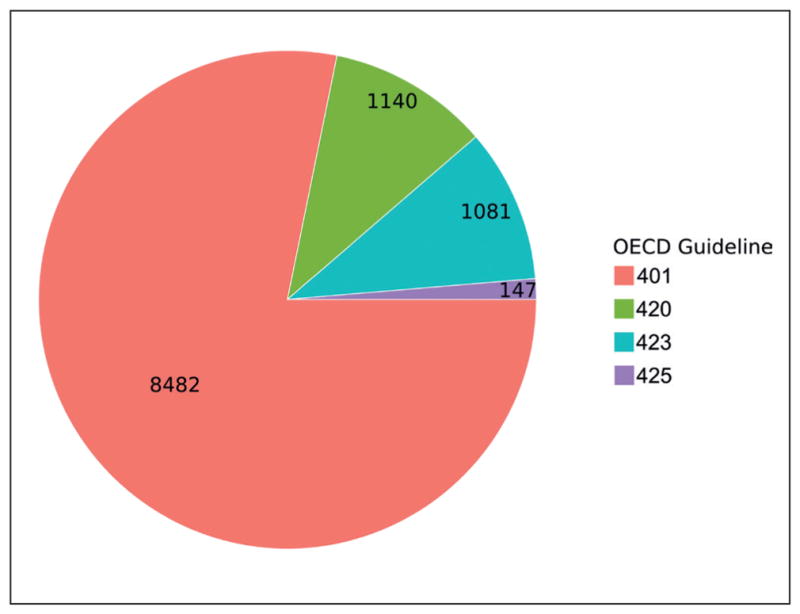
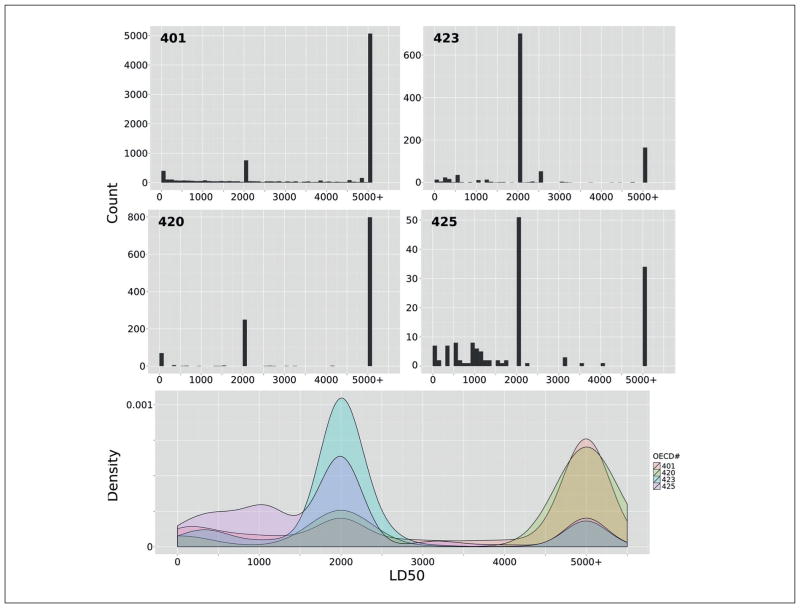
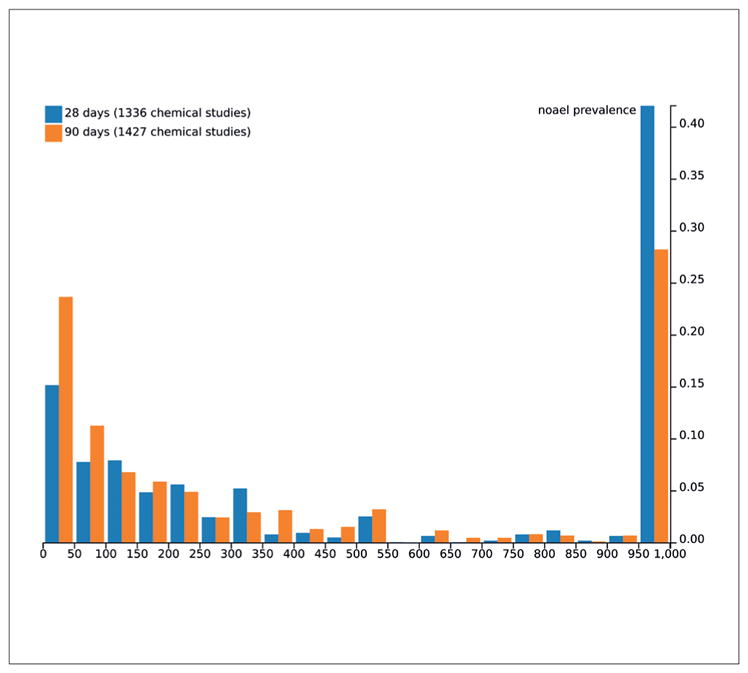
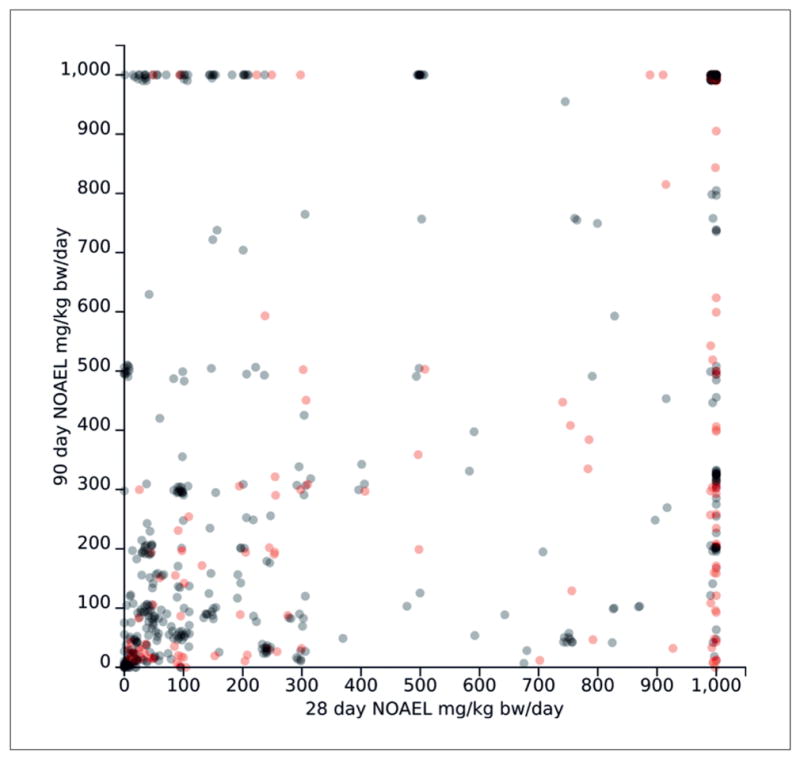
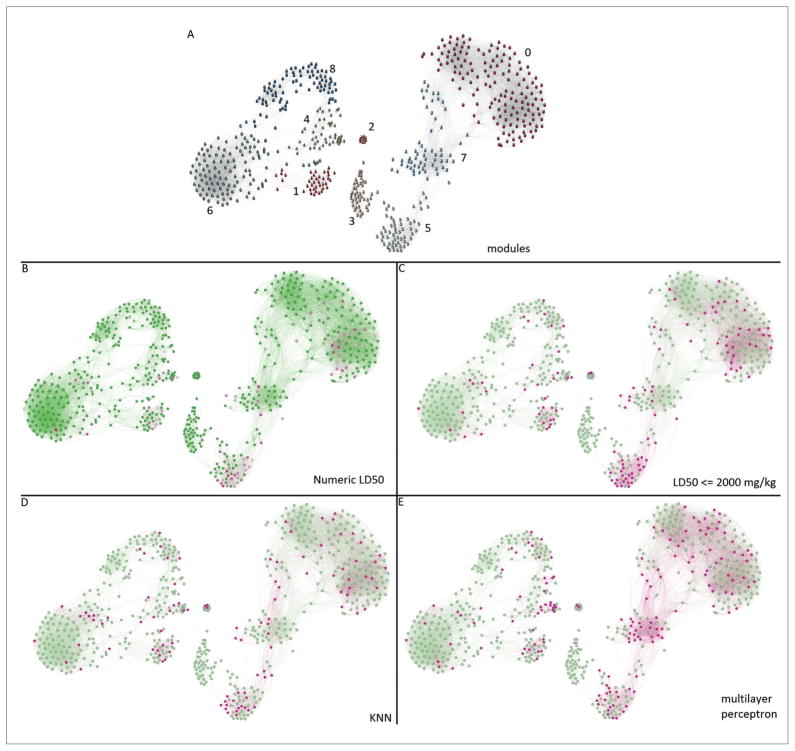
The European Chemicals Agency, ECHA, made available a total of 13,832 oral toxicity studies for 8,568 substances up to December 2014. 75% of studies were from the retired OECD Test Guideline 401 (11% TG 420, 11% TG 423 and 1.5% TG 425). Concordance across guidelines, evaluated by comparing LD50 values ≥ 2000 or < 2000 mg/kg body weight from chemicals tested multiple times between different guidelines, was at least 75% and for their own repetition more than 90%. In 2009, Bulgheroni et al. created a simple model for predicting acute oral toxicity using no observed adverse effect levels (NOAEL) from 28-day repeated dose toxicity studies in rats. This was reproduced here for 1,625 substances. In 2014, Taylor et al. suggested no added value of the 90-day repeated dose oral toxicity test given the availability of a low 28-day study with some constraints. We confirm that the 28-day NOAEL is predictive (albeit imperfectly) of 90-day NOAELs, however, the suggested constraints did not affect predictivity. 1,059 substances with acute oral toxicity data (268 positives, 791 negatives, all Klimisch score 1) were used for modeling: The Chemical Development Kit was used to generate 27 molecular descriptors and a similarity-informed multilayer perceptron showing 71% sensitivity and 72% specificity. Additionally, the k-nearest neighbors (KNN) algorithm indicated that similarity-based approaches alone may be poor predictors of acute oral toxicity, but can be used to inform the multilayer perceptron model, where this was the feature with highest information value.

Keywords: LD50; acute toxicity; chemical safety; computational toxicology; regulatory toxicology.


Conflict of interest statement

Conflict of interest

The authors have no conflict of interest to state.

Figures

Fig. 1
Fig. 1. Number of substances with studies for each of the acute oral toxicity OECD guidelines
The Limit Test (OECD TG 401, now deleted) was performed on 8,482 substances, the Fixed Dose Procedure (OECD TG 420) on 1,140 substances, the Chemical Classification Test (OECD TG 423) on 1,081 substances, and Up and Down Dosing (OECD TG 425) on 147 substances.
Fig. 2
Fig. 2. Histograms for use of OECD TG 401, 420, 423, and 425 in registrations of acute oral toxicant OECD TG 401, 423, 420, and 425
Y-axes are not equivalent. The x-axis represents LD50 for each OECD guideline. Density plot with overlapping densities between 0 and 5,000 mg/kg dosage. Notice the LD50 clustering around 2,000 and 5,000 mg/kg dosage; this is due to dosing schemes.
Fig 3
Fig 3. Prevalence frequency histogram of NOAELs for 28 and 90 day subchronic oral toxicity tests
This figure was made by aggregating results of 2,400 90-day tests and 1,933 28-day tests.
Fig. 4
Fig. 4. 28- and 90-day acute oral toxicity matched NOAELs
Circles represent the averaged 28 day (x-axis) and 90 day (y-axis) NOAEL for a given chemical taken from ECHA 28-day and 90-day oral toxicity studies. Red circles represent 200 substances matching the constraints given by Taylor et al. (2014).
Fig. 5
Fig. 5. Chemical similarity maps for substances with acute oral toxicity LD50 data that could be mapped from REACH to PubChem
The map contains 613 substances and is built from 3,122 substances mapped from REACH to PubChem and for which similarity and structure data could be determined from the chemistry development kit (Bolton et al., 2008; Steinbeck et al., 2003). Edges are shown between substances with similarity ≥ 0.7 as determined by their Tanimoto distance (Lourenço et al., 2004). The force layout algorithm is used to distribute substances (Fruchterman and Reingold, 1991). A. Similarity map modules: Nine modules are created by maximization of the Q-metric, a measure of module coherence (Blondel et al., 2008). Chemical nodes are colored by their module identification. B. Chemical similarity map colored by experimental LD50: Dark pink = low LD50, white = 1,000 mg/kg b.w./day, dark green = 2,000 mg/kg b.w./day. Results based on average LD50 values. Clusters of low LD50 values can be seen in module 5 and 0 with some otherwise sporadic distribution. C. Chemical similarity map colored by oral toxicant status: Pink substances denote LD50 < 2,000 mg/kg b.w. per day. Green substances denote LD50 ≥ 2,000 mg/kg b.w. per day (not classified). D. KNN classifications for LD50: Pink = predicted LD50 < 2,000 mg/kg b.w. per day. Green = predicted LD50 ≥ 2,000 mg/kg b.w. per day. Substances are predicted as toxicant if the majority of the closest 5 neighbors are toxicants. A chemical is considered a neighbor if it has Tanimoto similarity > 70% (Lourenço et al., 2004). E. Multilayer perceptron classifications for LD50: Pink = predicted LD50 < 2,000 mg/kg b.w. per day. Green = predicted LD50 ≥ 2,000 mg/kg b.w. per day. Classifier built on 1,059 substances referenced by at least one acute oral study with Klimisch score = 1. Classifications made by the multilayer perceptron appear to be well clustered; this indicates that chemical descriptors are influenced by substructure presence.

References

    1. Aha DW, Kibler D, Albert MK. Instance-based learning algorithms. Machine Learning. 1991;6:37–66.
    1. Aulmann W, Pechacek N. REACH (and CLP). Its role in regulatory toxicology. In: Reichl F-X, Schwenk M, editors. Regulatory Toxicology. Berlin, Heidelberg: Springer; 2014. pp. 779–795. http://doi.org/10.1007/978-3-642-35374-1_92. - DOI
    1. Bastian M, Heymann S, Jacomy M. Gephi: An open source software for exploring and manipulating networks. International AAAI Conference on Weblogs and Social Media (ICWSM) 2009;8:361–362. https://gephi.org/users/publications/
    1. Blondel VD, Guillaume JL, Lambiotte R, Lefebvre E. Fast unfolding of communities in large networks. J Statist Mechanics: Theory and Experiment. 2008;10:P10008. http://doi.org/10.1088/1742-5468/2008/10/P10008. - DOI
    1. Bolton EE, Wang Y, Thiessen PA, Bryant SH. PubChem: Integrated Platform of Small Molecules and Biological Activities. Vol. 4. Amsterdam: Elsevier; 2008. pp. 217–241. http://doi.org/10.1016/S1574-1400(08)00012-1. - DOI

Publication types

Substances

LinkOut - more resources