. 2016 Feb 11;374(6):555-61.
doi: 10.1056/NEJMoa1508808.

Clonal Immunoglobulin against Lysolipids in the Origin of Myeloma

Affiliations

Clonal Immunoglobulin against Lysolipids in the Origin of Myeloma

Shiny Nair et al. N Engl J Med. .

Abstract

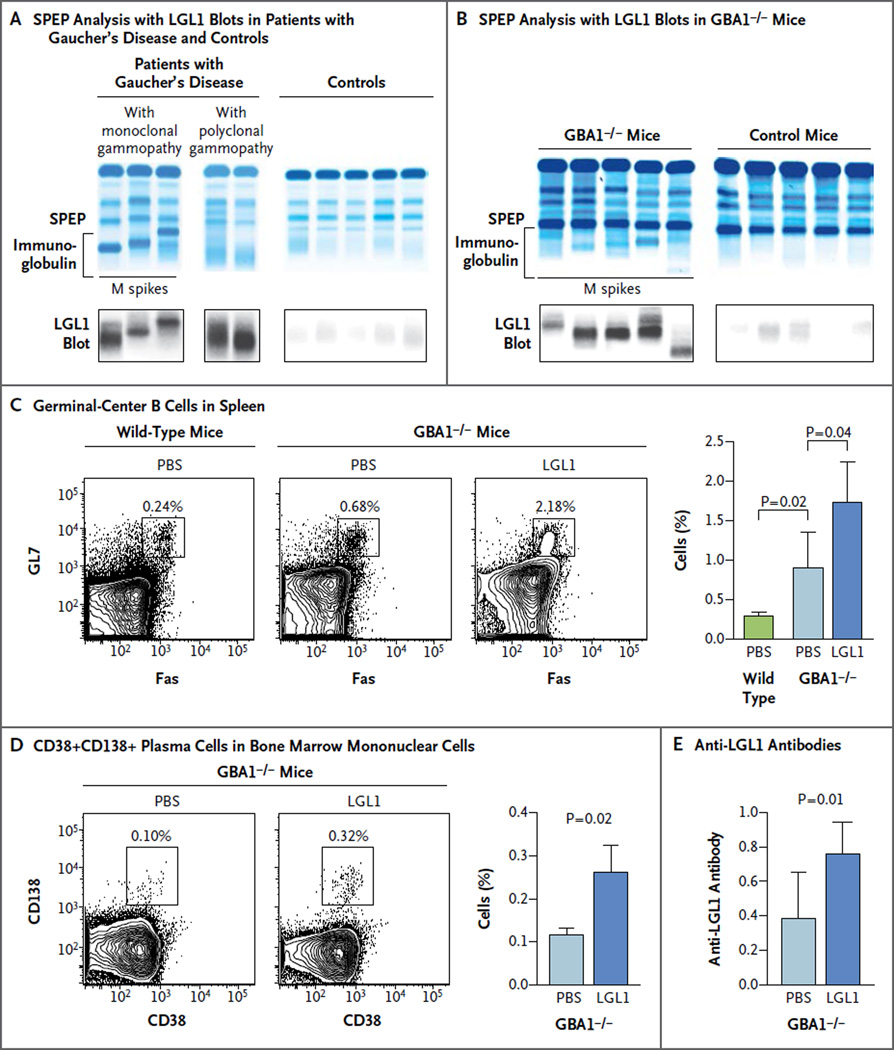
Antigen-driven selection has been implicated in the pathogenesis of monoclonal gammopathies. Patients with Gaucher's disease have an increased risk of monoclonal gammopathies. Here we show that the clonal immunoglobulin in patients with Gaucher's disease and in mouse models of Gaucher's disease-associated gammopathy is reactive against lyso-glucosylceramide (LGL1), which is markedly elevated in these patients and mice. Clonal immunoglobulin in 33% of sporadic human monoclonal gammopathies is also specific for the lysolipids LGL1 and lysophosphatidylcholine (LPC). Substrate reduction ameliorates Gaucher's disease-associated gammopathy in mice. Thus, long-term immune activation by lysolipids may underlie both Gaucher's disease-associated gammopathies and some sporadic monoclonal gammopathies.


Figures

Figure 1
Figure 1. Lipid Reactivity of Immunoglobulin in Patients and Mice with Gaucher’s Disease and in Controls
Serum specimens obtained from patients with Gaucher’s disease–associated monoclonal gammopathy or polyclonal gammopathy and from healthy controls were analyzed by means of serum protein electrophoresis (SPEP) (Panel A). The bracket shows the immunoglobulin component. In parallel, SPEP gel was blotted onto polyvinylidene fluoride membrane that was preincubated with lyso-glucosylceramide (LGL1) to identify LGL1-reactive immunoglobulins. SPEP was performed on serum specimens obtained from glucocerebrosidase- deficient (GBA1−/−) mice and from control mice that were matched for age and sex (Panel B). LGL1-specific blotting was performed simultaneously on serum specimens obtained from the GBA1−/− mice and the control mice. The M spikes in the serum specimens obtained from the GBA1−/− mice were reactive against LGL1. Representative contour plots show the percentage of FAS+GL7+ germinal-center B cells among total B cells (CD19+B220+) in splenocytes obtained from wild-type mice or GBA1−/− mice 7 days after three weekly injections with phosphate-buffered saline (PBS) or LGL1 (Panel C). The values above the insets indicate the percentage of cells in that particular gate. The bar graph shows the summary of the percentage of germinal-center B cells in splenocytes from wild-type mice and GBA1−/− mice 7 days after injection with PBS or LGL1. Data are means (from three mice); T bars indicate standard errors. A representative fluorescence- activated cell sorting plot (Panel D) shows the expression of CD38+CD138+ plasma cells in CD19−CD45lo bone marrow mononuclear cells (the gating strategy is shown in Fig. S1 in the Supplementary Appendix) obtained from GBA1−/− mice 7 days after PBS or LGL1 injection. Cumulative data show the percentage of CD38+CD138+ plasma cells. Data are means (from three mice); T bars indicate standard errors. The bar graph (Panel E) shows the presence of anti-LGL1 antibodies, with an optical density of 450 nm, in serum specimens obtained from GBA1−/− mice that had been injected with PBS or LGL1. Data are means; T bars indicate standard errors.
Figure 2
Figure 2. Lipid Reactivity of Immunoglobulin in Sporadic Gammopathy
Panel A shows the results of SPEP analysis, LGL1-specific blotting, and control blotting (with the use of human albumin as the control antigen) on serum specimens obtained from patients with monoclonal gammopathy, showing lipid reactivity or no lipid reactivity, and from healthy controls. Panel B shows the results of lysophosphatidylcholine (LPC)–specific blotting, which was performed on serum specimens obtained from the same patients and healthy controls. Panel C shows the results of SPEP analysis, followed by LGL1, cardiolipin, lipid A, and diacylglycerol (DAG)–specific blotting on purified immunoglobulin obtained from patients with monoclonal gammopathy without Gaucher’s disease (sporadic monoclonal gammopathy), patients with Gaucher’s disease– associated monoclonal gammopathy, and healthy controls. Panel D shows the ligand-dependent enrichment of clonal immunoglobulin. Serum specimens obtained from three patients with lipid-reactive monoclonal gammopathy and three patients with lipid-nonreactive monoclonal gammopathy were incubated with control (C) or sphingosine (S)–coated sepharose beads; the bead-binding fraction was analyzed for the presence of clonal immunoglobulin by Western blot. The bottom panels show densitometric quantitation of bands performed with the use of ImageJ software. Panel E shows the ligand-dependent depletion of clonal immunoglobulin. Serum specimens from three patients with lipid-reactive monoclonal gammopathy and three patients with lipid-nonreactive monoclonal gammopathy were incubated with control or sphingosine-coated sepharose beads. The flow-through fraction was analyzed for M-spike depletion by means of SPEP. The bottom panels show densitometric quantitation of bands performed with the use of ImageJ software. The bar graph in Panel F shows the percent reduction in anti-LGL1 antibodies in serum specimens obtained from GBA1−/− mice after treatment with eligulstat (test diet), as compared with mice that received the control diet. Data are means; T bars indicate standard errors. The bar graph in Panel G shows the percent reduction in the M-spike intensity in serum specimens obtained from GBA1−/− mice after treatment with the test diet, as compared with mice that received the control diet. Data are means; T bars indicate standard errors.

References

    1. Palumbo A, Anderson K. Multiple myeloma. N Engl J Med. 2011;364:1046–1060. - PubMed
    1. Sahota SS, Leo R, Hamblin TJ, Stevenson FK. Myeloma VL and VH gene sequences reveal a complementary imprint of antigen selection in tumor cells. Blood. 1997;89:219–226. - PubMed
    1. Sahota SS, Leo R, Hamblin TJ, Stevenson FK. Ig VH gene mutational patterns indicate different tumor cell status in human myeloma and monoclonal gammopathy of undetermined significance. Blood. 1996;87:746–755. - PubMed
    1. Zojer N, Ludwig H, Fiegl M, Stevenson FK, Sahota SS. Patterns of somatic mutations in VH genes reveal pathways of clonal transformation from MGUS to multiple myeloma. Blood. 2003;101:4137–4139. - PubMed
    1. Bakkus MH, Heirman C, Van Riet I, Van Camp B, Thielemans K. Evidence that multiple myeloma Ig heavy chain VDJ genes contain somatic mutations but show no intraclonal variation. Blood. 1992;80:2326–2335. - PubMed

Publication types

LinkOut - more resources