. 2016 Feb 9;23(2):265-79.
doi: 10.1016/j.cmet.2016.01.002.

HIF-1α Promotes Glutamine-Mediated Redox Homeostasis and Glycogen-Dependent Bioenergetics to Support Postimplantation Bone Cell Survival

Affiliations

HIF-1α Promotes Glutamine-Mediated Redox Homeostasis and Glycogen-Dependent Bioenergetics to Support Postimplantation Bone Cell Survival

Steve Stegen et al. Cell Metab. .

Abstract

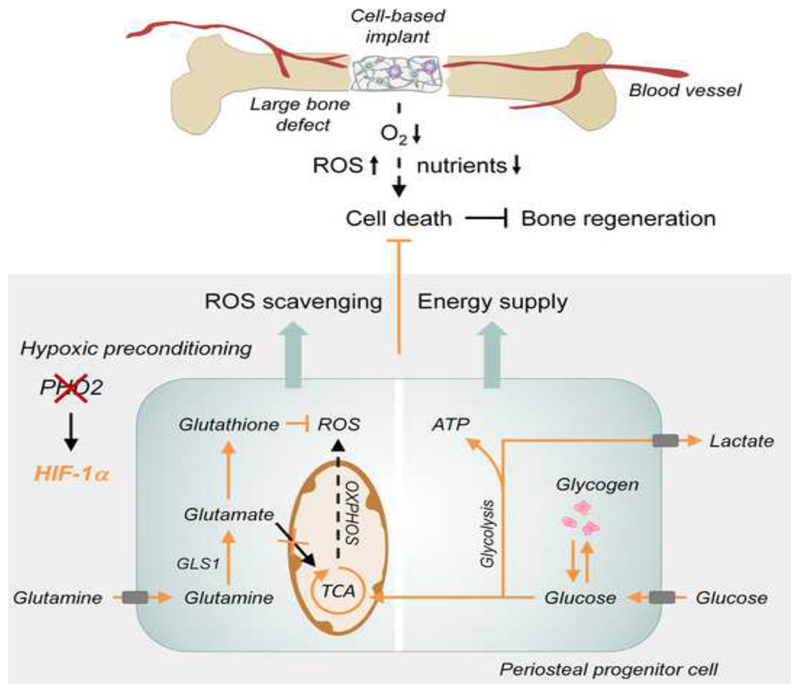
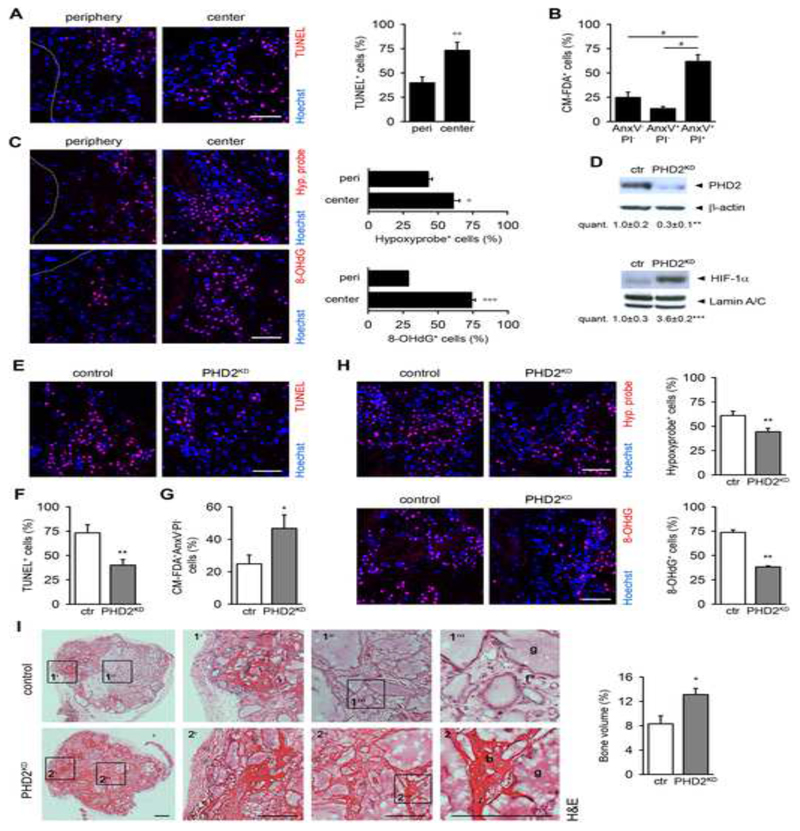
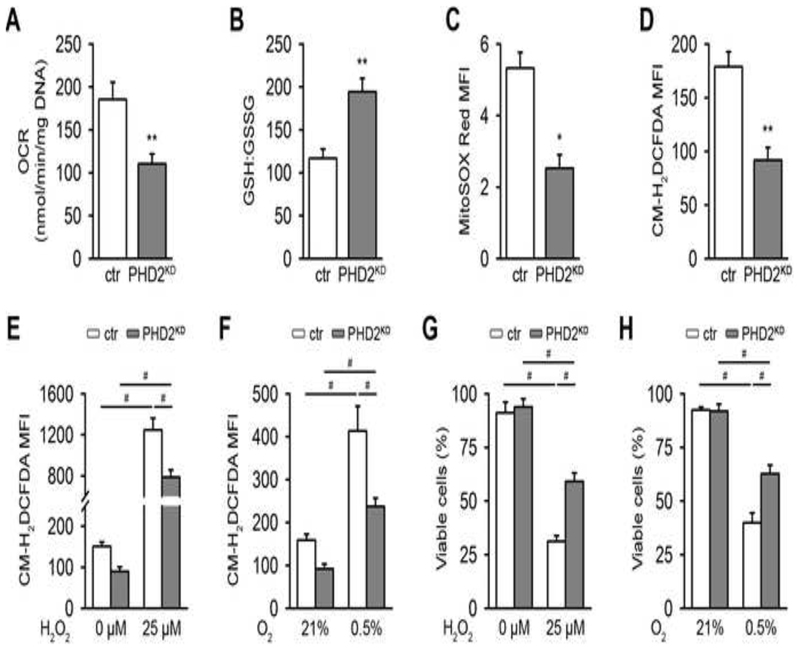
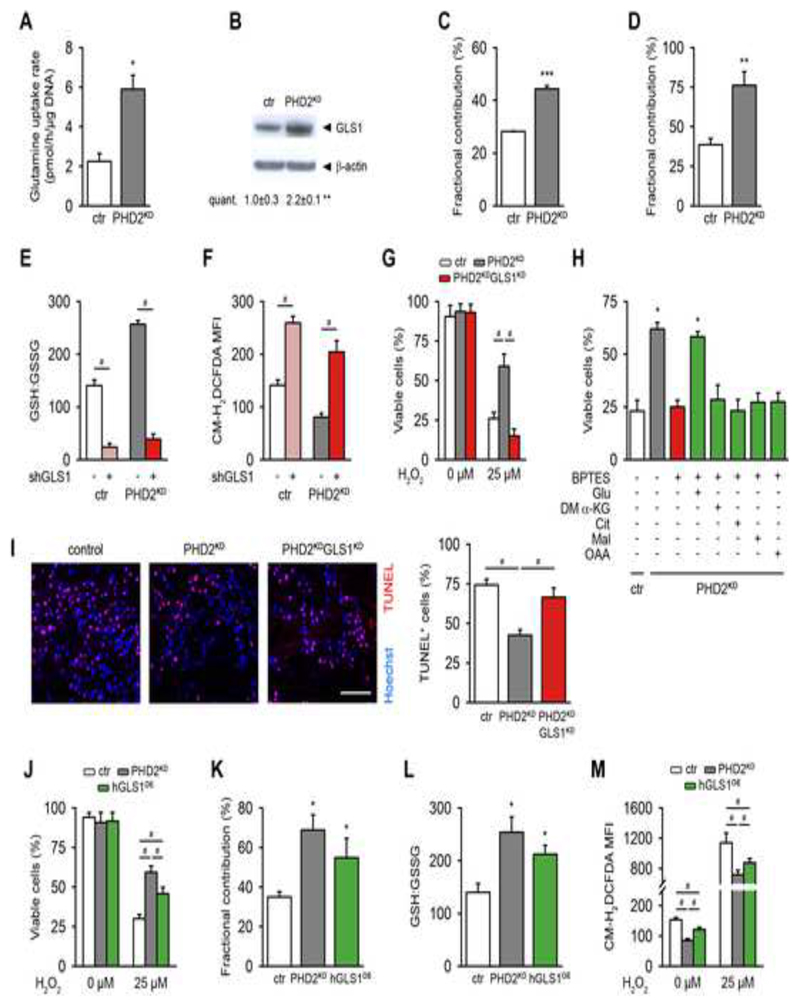
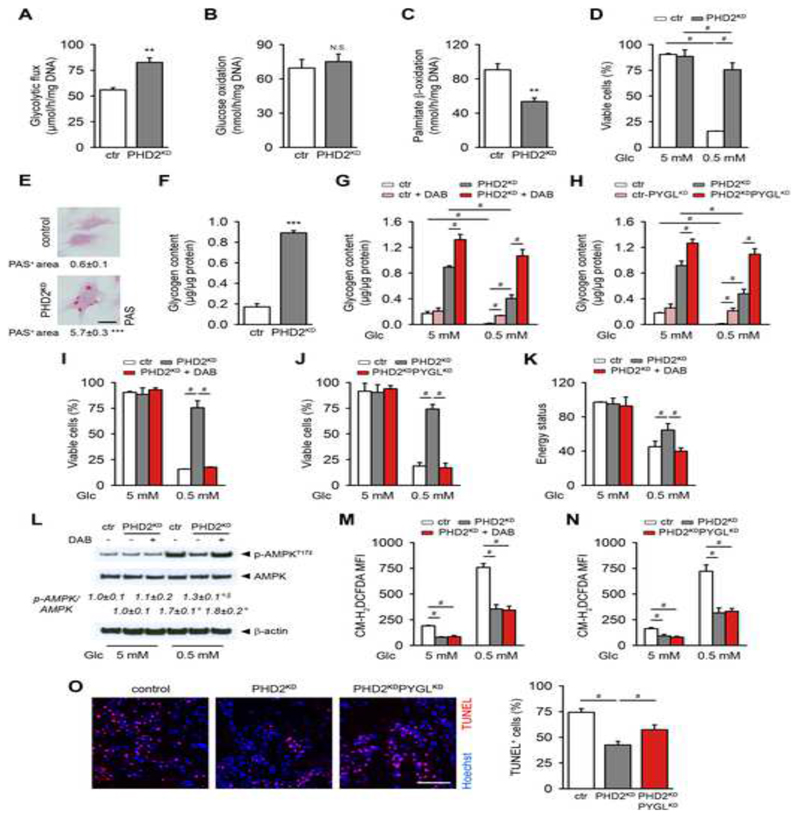
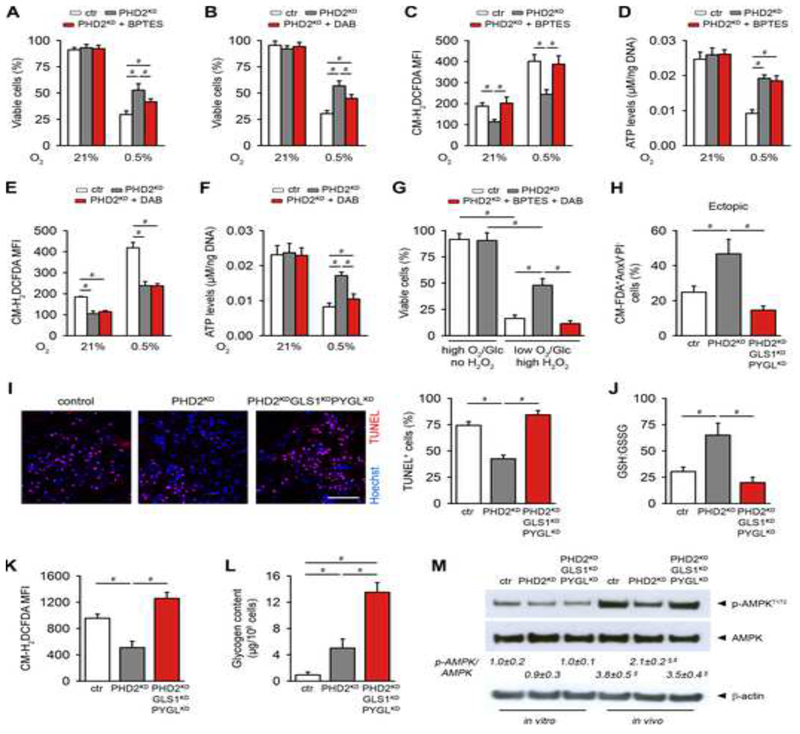
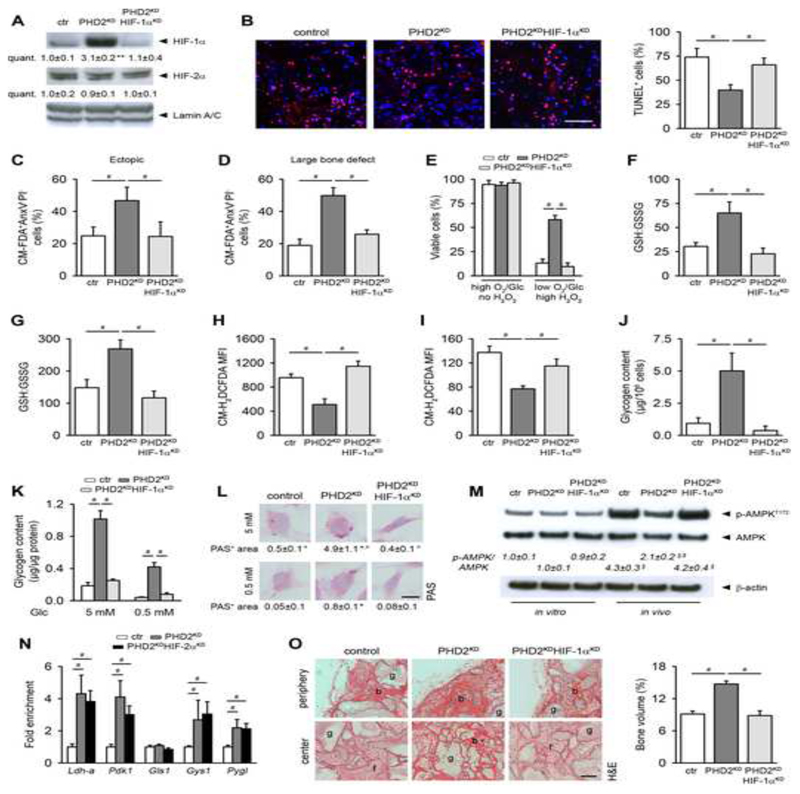
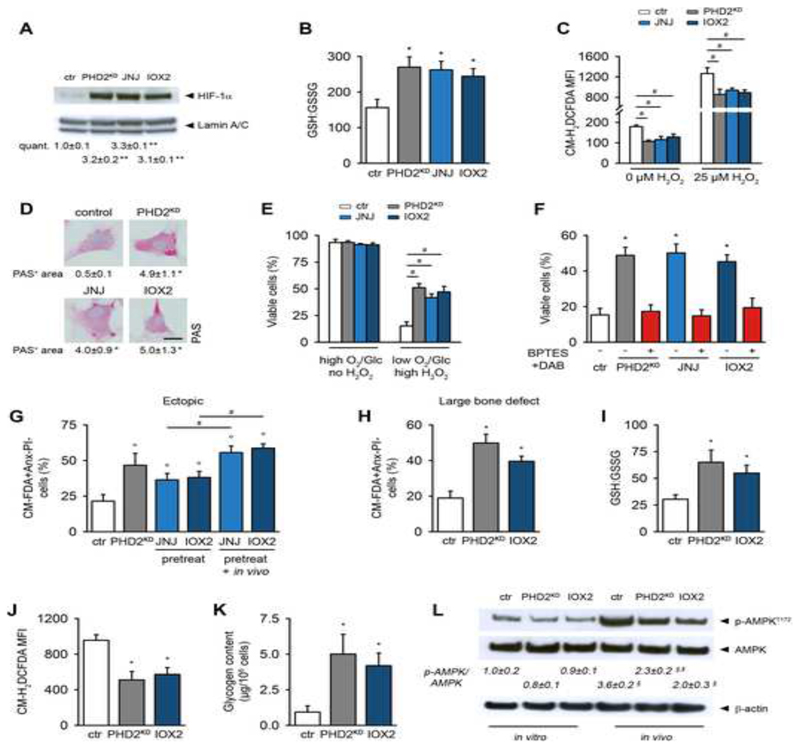
Cell-based therapy is a promising strategy in regenerative medicine, but the poor survival rate of the implanted cells remains a major challenge and limits clinical translation. We preconditioned periosteal cells to the hypoxic and ischemic environment of the bone defect site by deleting prolyl hydroxylase domain-containing protein 2 (PHD2), resulting in hypoxia-inducible factor 1 alpha (HIF-1α) stabilization. This strategy increased postimplantation cell survival and improved bone regeneration. The enhanced cell viability was angiogenesis independent but relied on combined changes in glutamine and glycogen metabolism. HIF-1α stabilization stimulated glutaminase-mediated glutathione synthesis, maintaining redox homeostasis at baseline and during oxidative or nutrient stress. Simultaneously, HIF-1α signaling increased glycogen storage, preventing an energy deficit during nutrient or oxygen deprivation. Pharmacological inhibition of PHD2 recapitulated the adaptations in glutamine and glycogen metabolism and, consequently, the beneficial effects on cell survival. Thus, targeting cellular metabolism is an appealing strategy for bone regeneration and cell-based therapy in general.


Figures

Graphical Abstract
Graphical Abstract
Figure 1
Figure 1. Deletion of PHD2 Improves Cell Survival and Bone Regeneration
(A) TUNEL immunostaining of scaffolds seeded with mouse periosteum-derived cells (mPDC), and quantification at the periphery (peri) or center (n=4). (B) Ex vivo Annexin V-PI (AnxV-PI) flow cytometry analysis of CM-FDA-labeled implanted cells (n=3). (C) Hypoxyprobe (Hyp. probe) and 8-OHdG immunostaining, and quantification at the periphery or center (n=4). (D) PHD2, β-actin, HIF-1α and Lamin A/C immunoblot on mPDC lysates, 3 days after transduction of Phd2fl/fl cells with Ad-GFP (control; ctr) or Ad-Cre (PHD2KD) (n=3). (E-F) TUNEL immunostaining (E) with quantification (F) in the scaffold center (n=8). (G) Ex vivo quantification of the viable implanted (CM-FDA+AnxV-PI- cells (n=3-4). (H) Hypoxyprobe and 8-OHdG immunostaining of the center of the scaffold (n=4), with quantification. (I) H&E staining with quantification of the newly formed bone in the total scaffold (n=8). Boxed areas at the periphery (1’, 2’) or center (1”, 2”) are subsequently magnified (b, bone; f, fibrous tissue; g, scaffold granule). A-C and E-H: analysis at day 3 after implantation; I, after 8 weeks. Scale bars: 100 μm in A, C, E and H; 500 μm in I. Dotted lines indicate scaffold boundaries. Data are means ± SEM. °p<0.05 vs. peri, °°p<0.01 vs. peri, °°°p<0.001 vs. peri, *p<0.05 vs. ctr, **p<0.01 vs. ctr, ***p<0.001 vs. ctr (Student’s t-test), #p<0.05 (ANOVA).
Figure 2
Figure 2. PHD2KD Cells Are Metabolically Reprogrammed
(A) Basal oxygen consumption rate (OCR) of cultured control (ctr) and PHD2KD mPDC (n=6). (B) Ratio of reduced glutathione (GSH) to oxidized glutathione (GSSG) (n=6). (C-D) Mean fluorescent intensity (MFI) of mitochondrial (MitoSOX Red; C) or intracellular ROS levels (CM-H2DCFDA; D) by flow cytometry analysis (n=6-9). (E-F) Intracellular ROS levels after treatment with 25 μM H2O2 (E) or culture in 0.5% oxygen (O2; F) (n=6). (G-H) Cell viability analysis after treatment with 25 μM H2O2 (G) or culture in 0.5% O2 (H), by AnxV-PI flow cytometry (n=9). Data are means ± SEM. *p<0.05 vs. ctr, **p<0.01 vs. ctr (Student’s t-test), #p<0.05 (ANOVA).
Figure 3
Figure 3. GLS1 Regulates Glutamine-mediated ROS Scavenging in PHD2KD Cells and Contributes to Cell Survival
(A) Glutamine uptake rate in cultured control (ctr) and PHD2KD cells (n=6). (B) GLS1 and β-actin immunoblot (n=3). (C-D) Fractional contribution of [U-13C]-glutamine to glutamate (C) and GSH (D) (n=3-6). (E-F) GSH to GSSG levels (E) and total intracellular ROS levels (F) in control and PHD2KD cells after genetic silencing of GLS1 (scrambled shRNA (shScr: -) or shGLS1 (+)) (n=6). (G) Control, PHD2KD and PHD2KDGLS1KD cell viability after treatment with 25 μM H2O2 (n=6). PHD2KDGLS1KD cells are PHD2KD cells transduced with shGLS1; ctr and PHD2KD cells are transduced with shScr. (H) Rescue of cell viability of BPTES-treated PHD2KD cells during oxidative stress (25 μM H2O2) with glutamate (Glu), but not with dimethyl α-ketoglutarate (DM α-KG), citrate (Cit), malate (Mal) or oxaloacetate (OAA) (n=9). (I) TUNEL immunostaining of the scaffold center 3 days after implantation, and quantification (scale bar, 100 μm; n=4). (J) Cell viability of control, PHD2KD and hGLS1-overexpressing (hGLS1OE) cells after treatment with 25 μM H2O2 (n=6). (K) Fractional contribution of [U-13C]-glutamine to GSH (n=6). (L) Ratio of GSH to GSSG (n=6). (M) Total intracellular ROS levels with and without H2O2 treatment (n=6). Data are means ± SEM. *p<0.05 vs. ctr, **p<0.01 vs. ctr, ***p<0.001 vs. ctr (Student’s t-test), #p<0.05 (ANOVA).
Figure 4
Figure 4. Glycogen Storage Contributes to PHD2KD Cell Survival by Supplying Energy
(A) Glycolytic flux of cultured control (ctr) and PHD2KD mPDC (n=9). (B) Glucose oxidation rate (N.S. is not significant, n=9). (C) Palmitate β-oxidation (n=6). (D) Cell viability during normal (5 mM glucose) or glucose-deprived conditions (0.5 mM glucose) (n=9). (E-F) Intracellular glycogen deposition, quantified after periodic acid-Schiff (PAS) staining (E) or determined after extraction (F) (n=9). (G-H) Cellular glycogen content after inhibition of PYGL with DAB (G) or shRNA (PYGLKD; H) (n=6). (I-J) Cell viability of control, PHD2KD and PHD2KD cells after inhibition of PYGL. PYGL was inhibited in PHD2KD cells using DAB (I) or shRNA (PHD2KDPYGLKD; J) (n=4-6). (K) Energy status (ratio of ATP to AMP levels) (n=3). (L) P-AMPKT172, AMPK and β-actin immunoblot, with quantification of p-AMPKT172 to AMPK ratio (n=3). (M-N) Intracellular ROS levels in control, PHD2KD and PHD2KD cells after inhibition of PYGL. PYGL was inhibited in PHD2KD cells using DAB (M) or shRNA (PHD2KDPYGLKD; N) (n=4-6). (O) TUNEL immunostaining with quantification of TUNEL+ cells in the scaffold center at day 3 after implantation (scale bar, 100 μm; n=4). Data are means ± SEM. **p<0.01 vs. ctr, ***p<0.001 vs. ctr (Student’s t-test), #p<0.05, °p<0.05 vs. ctr in normal culture conditions, §p<0.05 vs. ctr during glucose deprivation (ANOVA).
Figure 5
Figure 5. The Combinational Changes in Glutamine and Glycogen Metabolism Are Necessary for PHD2KD Cell Viability
(A-B) Analysis of cell viability of control (ctr), PHD2KD and BPTES (A) or DAB-treated (B) PHD2KD cells during hypoxia (0.5% oxygen (O2)) (n=6). (C-F) Intracellular ROS levels (C,E) and quantification of intracellular ATP levels (D,F) in ctr, PHD2KD and PHD2KD cells after treatment with BPTES (C,D) or DAB (E,F) during hypoxia (n=6). (G) Cell viability of cultured ctr cells, PHD2KD cells and PHD2KD cells after treatment with BPTES and DAB during normal or combined stress conditions (1% O2), 1 mM glucose (Glc) and 12 μM H2O2 (high H2O2); n=4). (H) Cell viability 3 days after in vivo ectopic implantation. Viable cells are CM-FDA+AnxV-PI- (n=4). (I) TUNEL immunostaining and quantification of the percentage of TUNEL+ cells in the center of the scaffold (scale bar, 100 μm; n=4). (J) Ratio of GSH to GSSG in implanted CMRA-labeled ctr, PHD2KD and PHD2KDGLS1KDPYGLKD cells (n=3-4). (K) In vivo intracellular ROS levels in implanted CMRA-labeled ctr, PHD2KD and PHD2KDGLS1KDPYGLKD cells (n=3-4). (L) Glycogen content in implanted CMRA-labeled ctr, PHD2KD and PHD2KDGLS1KDPYGLKD cells (n=3-4). (M) P-AMPKT172, AMPK and β-actin immunoblot on ctr, PHD2KD and PHD2KDGLS1KDPYGLKD cells cultured in vitro or after in vivo implantation of CMRA-labeled cells, with quantification of p-AMPKT172 to AMPK ratio (n=3-4). H-M: analysis at day 3 after implantation. Data are means ± SEM. #p<0.05, §p<0.05 vs ctr in vitro, §p<0.05 vs ctr in vivo (ANOVA).
Figure 6
Figure 6. HIF-1α Mediates the Positive Effects on Cell Survival, Bone Regeneration and Angiogenesis in PHD2KD Periosteal Cells
(A) HIF-1α, HIF-2α and Lamin A/C immunoblot of control (ctr), PHD2KD and PHD2KDHIF-1αKD cells (n=2-3). (B) Immunohistological quantification of TUNEL+ cells in the scaffold center 3 days after implantation (n=4). (C-D) Ex vivo cell viability of CM-FDA labeled cells 3 days after implantation (ectopic model, C; large bone defect, D) Viable cells are CM-FDA+AnxV-P- (n=3-4). (E) Cell viability analysis on cells cultured in combined stress conditions (1% oxygen (O2), 1 mM glucose (Glc), 12 μM H2O2 (high H2O2)). Viable cells are AnxV-PI- (n=6). (F-G) Ratio of GSH to GSSG in in vivo implanted (F; n=3-4) or in vitro cultured (G; n=6) ctr, PHD2KD and PHD2KDHIF-1αKD cells. (H-I) In vivo intracellular ROS levels in CMRA-labeled ctr, PHD2KD and PHD2KDHIF-1αKD cells (H; n=3-4) or in vitro cultured cells (I; n=6). (J) Glycogen content of implanted CMRA-labeled ctr, PHD2KD and PHD2KDHIF-1αKD cells (n=3-4). (K-L) Intracellular glycogen deposition, determined after extraction from cells (K) or quantified after PAS staining (L) during normal culture conditions or glucose deprivation (n=4). (M) P-AMPKT172, AMPK and β-actin immunoblot of ctr, PHD2KD and PHD2KDHIF-1αKD cells cultured in vitro or after in vivo implantation of CMRA-labeled cells, with quantification of p-AMPKT172 to AMPK ratio (n=3-4). (N) Fold enrichment of HIF-1β binding to promotor regions of Ldh-a, Pdk1, Gls1, Gys1 and Pygl in ctr, PHD2KD and PHD2KDHIF-2αKD cells, as determined by ChIP-qPCR (n=6). (O) H&E staining on ectopically implanted scaffolds 8 weeks after implantation with quantification of the amount of bone formed in the total scaffold (b, bone; f, fibrous tissue; g, scaffold granule; scale bar, 500 μm; n=4). Data are means ± SEM. *p<0.05 vs. ctr, **p<0.01 vs. ctr, °p<0.05 vs. ctr during glucose deprivation (Student’s t-test), #p<0.05, §p<0.05 vs ctr in vitro, §p<0.05 vs ctr in vivo (ANOVA).
Figure 7
Figure 7. Pharmacological Blockade of PHDs Mimics the Effects Observed in PHD2KD Cells
(A) HIF-1α and Lamin A/C immunoblot. Protein fractions were obtained 3 days after transduction of Phd2fl/fl cells with Ad-Cre (PHD2KD) or after 3-day treatment of wild-type cells with JNJ or IOX2 (n=3). (B) GSH to GSSG levels in control (ctr), PHD2KD, and wild-type cells treated with JNJ or IOX2 (n=6). (C) Quantification of intracellular ROS levels in basal conditions or after treatment with 25 μM H2O2 (n=6). (D) Visualization of cytoplasmic glycogen stores by PAS staining and quantification (n=4). (E) Cell viability during normal or combined stress conditions (1% oxygen (O2), 1mM glucose (Glc) and 12 μM H2O2 (high H2O2)) (n=6). (F) Cell viability of cells treated with BPTES and DAB during combined stress conditions (n=6). (G-H) Ex vivo cell viability 3 days after in vivo implantation (ectopic model, G; large bone defect, H). Compounds were also locally injected to half of the scaffolds seeded with pretreated cells (pretreat + in vivo, G). Viable cells are CM-FDA+AnxV-PI- (n=4). (I) Ratio of GSH to GSSG in in vivo implanted CMRA-labeled ctr, PHD2KD and IOX2-treated wild-type cells (n=3-4). (J) Flow cytometry analysis of in vivo total intracellular ROS levels in CMRA-labeled ctr, PHD2KD and IOX2-treated wild-type cells (n=3-4). (K) Glycogen content of implanted CMRA-labeled ctr, PHD2KD and IOX2-treated wild-type cells (n=3-4). (L) P-AMPKT172, AMPK and β-actin immunoblot of ctr, PHD2KD and IOX2-treated wild-type cells, cultured in vitro or after in vivo implantation of CMRA-labeled cells, with quantification of p-AMPKT172 to AMPK ratio (n=3-4). Data are means ± SEM. *p<0.05 vs. ctr, **p<0.01 vs. ctr, (Student’s t-test), °p<0.05 vs. ctr (ANOVA), #p<0.05 (ANOVA).

Similar articles

Cited by

References

    1. Aragones J, Fraisl P, Baes M, Carmeliet P. Oxygen sensors at the crossroad of metabolism. Cell Metab. 2009;9:11–22. - PubMed
    1. Buescher JM, Antoniewicz MR, Boros LG, Burgess SC, Brunengraber H, Clish CB, DeBerardinis RJ, Feron O, Frezza C, Ghesquiere B, Gottlieb E, et al. A roadmap for interpreting C metabolite labeling patterns from cells. Curr Opin Biotechnol. 2015;34C:189–201. - PMC - PubMed
    1. Curcio E, Salerno S, Barbieri G, De Bartolo L, Drioli E, Bader A. Mass transfer and metabolic reactions in hepatocyte spheroids cultured in rotating wall gas-permeable membrane system. Biomaterials. 2007;28:5487–5497. - PubMed
    1. DeBerardinis RJ, Lum JJ, Hatzivassiliou G, Thompson CB. The biology of cancer: metabolic reprogramming fuels cell growth and proliferation. Cell Metab. 2008;7:11–20. - PubMed
    1. Esen E, Chen J, Karner CM, Okunade AL, Patterson BW, Long F. WNT-LRP5 signaling induces Warburg effect through mTORC2 activation during osteoblast differentiation. Cell Metab. 2013;17:745–755. - PMC - PubMed

Publication types

MeSH terms