. 2016 Mar 15;196(6):2885-92.
doi: 10.4049/jimmunol.1402695. Epub 2016 Feb 10.

Regulatory T Cells in Melanoma Revisited by a Computational Clustering of FOXP3+ T Cell Subpopulations

Affiliations

Regulatory T Cells in Melanoma Revisited by a Computational Clustering of FOXP3+ T Cell Subpopulations

Hiroko Fujii et al. J Immunol. .

Abstract

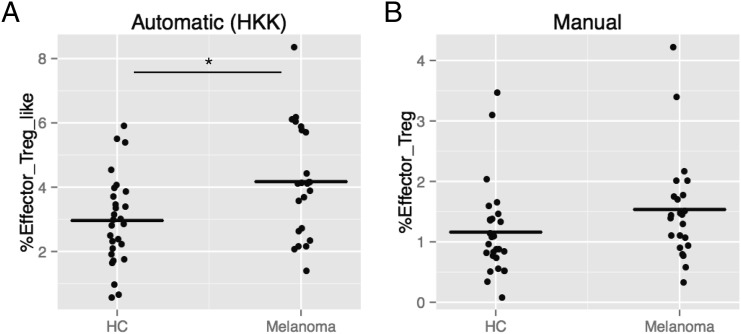
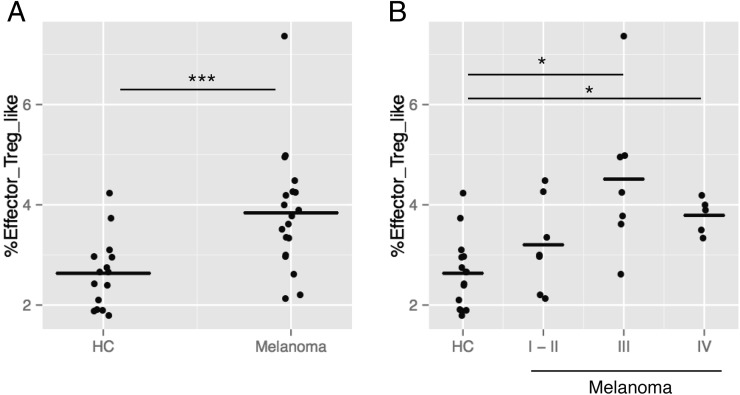
CD4(+) T cells that express the transcription factor FOXP3 (FOXP3(+) T cells) are commonly regarded as immunosuppressive regulatory T cells (Tregs). FOXP3(+) T cells are reported to be increased in tumor-bearing patients or animals and are considered to suppress antitumor immunity, but the evidence is often contradictory. In addition, accumulating evidence indicates that FOXP3 is induced by antigenic stimulation and that some non-Treg FOXP3(+) T cells, especially memory-phenotype FOXP3(low) cells, produce proinflammatory cytokines. Accordingly, the subclassification of FOXP3(+) T cells is fundamental for revealing the significance of FOXP3(+) T cells in tumor immunity, but the arbitrariness and complexity of manual gating have complicated the issue. In this article, we report a computational method to automatically identify and classify FOXP3(+) T cells into subsets using clustering algorithms. By analyzing flow cytometric data of melanoma patients, the proposed method showed that the FOXP3(+) subpopulation that had relatively high FOXP3, CD45RO, and CD25 expressions was increased in melanoma patients, whereas manual gating did not produce significant results on the FOXP3(+) subpopulations. Interestingly, the computationally identified FOXP3(+) subpopulation included not only classical FOXP3(high) Tregs, but also memory-phenotype FOXP3(low) cells by manual gating. Furthermore, the proposed method successfully analyzed an independent data set, showing that the same FOXP3(+) subpopulation was increased in melanoma patients, validating the method. Collectively, the proposed method successfully captured an important feature of melanoma without relying on the existing criteria of FOXP3(+) T cells, revealing a hidden association between the T cell profile and melanoma, and providing new insights into FOXP3(+) T cells and Tregs.


Figures

FIGURE 1.
FIGURE 1.
Manual gating approach to classify the FOXP3+ T cell subpopulations. The manual gating approach to identify and classify FOXP3+ T cell subpopulations is depicted. (A) Representative flow cytometric data showing the three subsets of FOXP3+ T cells in PBMCs: CD45RO+FOXP3high effector Treg, CD45ROFOXP3low naive Treg, and CD45RO+FOXP3low non-Treg. These subpopulations are classified in a sequential manner using the following four gates: (B) the lymphocyte gate on the window displaying FSC and SSC, (C) the CD4+ gate using CD4 and SSC, (D) the FOXP3+ gate using FOXP3 and CD45RO, and (E) the FOXP3+ T cell subpopulation gate using FOXP3 and CD45RO. The level of FOXP3high and FOXP3low cells was determined so that CD45ROFOXP3high cells were <0.2% of CD4+ T cells.
FIGURE 2.
FIGURE 2.
Automatic gating of FOXP3+CD4+ T cells. Three clustering methods were compared for identifying FOXP3+CD4+ T cells: CD4+ T cell selection by HDDC, followed by FOXP3+ T cell selection by k-means (HK clustering); CD4+ T cell selection by HDDC, followed by FOXP3+ T cell selection by HDDC (HH clustering); and FOXP3+CD4+ T cell selection by one step-HDDC (one-step H clustering). Various random number seeds were used to resample events from flow cytometric data, and resampling was repeated 100 times for each random number seed, to address the robustness and efficiency of the three clustering methods. Sensitivities and accuracies were calculated by assuming that the manual gating provides a gold standard. (AC) Sensitivities and accuracies of HK and HH: (A) sensitivities and accuracies for identifying CD4+ T cells by HDDC (shared by HK and HH). (B and C) Sensitivities and accuracies of (B) k-means and (C) HDDC for identifying FOXP3+ T cells from the identified CD4+ T cell cluster (HK and HH, respectively). (D) Sensitivities and accuracies of HDDC for identifying FOXP3+ T cells from all cells (one-step H). (EG) Representative plots of automatically gated FOXP3+CD4+ T cells by the HK clustering method for (E and F) CD4+ T cells and (G) FOXP3+ T cells. The clustered cells are shown by black dots.
FIGURE 3.
FIGURE 3.
Automatic clustering of FOXP3+ CD4+ T cell subpopulations. K-means and HDDC were used for classifying the computationally clustered FOXP3+ T cells into three subpopulations, and we compared them for stability using a resampling approach, which was repeated 100 times. (AD) Box plots showing (A) the percentages and the mean fluorescence intensities (MFI) of (B) CD45RO, (C) CD25, or (D) FOXP3 of each FOXP3+ T cell subcluster in CD4+ T cells by either k-means or HDDC in the 100 resampled samples (i.e., HKK or HKH, respectively). (E and F) Representative plots of FOXP3+ T cell subpopulations (E) by the HKK clustering (automatic) and (F) by manual gating.
FIGURE 4.
FIGURE 4.
Comparison of the FOXP3+ T cell clusters/populations identified by the automatic and manual gating approaches. (AD) The automatic (the HKK clustering) and manual gating approaches were compared by spaghetti plots of the percentage of the cells that were classified as (A) effector-Treg–like, (B) non-Treg–like, and (C) naive-Treg–like, and (D) all FOXP3+ T cells, in all samples including HCs and melanoma patients. (EH) Scatterplots showing the percentages of each FOXP3+ T cell cluster/population by automatic (the HKK clustering) and manual gating: (E) effector-Treg–like, (F) non-Treg–like, and (G) naive-Treg–like, and (H) all FOXP3+ T cells. Closed and open circles represent melanoma and HC samples, respectively. All percentages are in CD4+ T cells. Pearson correlation coefficient (r) was calculated using all the samples for each cluster.
FIGURE 5.
FIGURE 5.
Effector-Treg–like cluster in HC and melanoma patients by the automatic HKK clustering or manual gating. (A) Box plot showing the percent effector-Treg–like/CD4 of HC and melanoma patients by the automatic HKK clustering. *Adjusted p < 0.05. (B) Box plot showing the percent effector-Treg/CD4 of HCs and melanoma patients by manual gating.
FIGURE 6.
FIGURE 6.
Application of the automatic gating approach to an independent data set. The established automatic gating method, the HKK clustering, was applied to an independent data set (the second data set, see Table I). (A) Box plots showing %(effector-Treg–like)/CD4 in HCs and melanoma patients (***adjusted p = 0.0015). (B) Box plots showing %(effector-Treg–like)/CD4 in HCs and different disease stages of melanoma patients (I-II, III, or IV). A Kruskal–Wallis test showed that the percentages were significantly different across different statuses (adjusted p = 0.0014). Pairwise comparisons were done by a Mann–Whitney–Wilcoxon test, showing significant differences (*adjusted p < 0.05).

References

    1. Sakaguchi S., Yamaguchi T., Nomura T., Ono M. 2008. Regulatory T cells and immune tolerance. Cell 133: 775–787. - PubMed
    1. Gallimore A., Godkin A. 2008. Regulatory T cells and tumour immunity - observations in mice and men. Immunology 123: 157–163. - PMC - PubMed
    1. Zou W. 2006. Regulatory T cells, tumour immunity and immunotherapy. Nat. Rev. Immunol. 6: 295–307. - PubMed
    1. Motz G. T., Coukos G. 2013. Deciphering and reversing tumor immune suppression. Immunity 39: 61–73. - PMC - PubMed
    1. deLeeuw, R. J., S. E. Kost, J. A. Kakal, and B. H. Nelson. 2012. The prognostic value of FoxP3+ tumor-infiltrating lymphocytes in cancer: a critical review of the literature. Clin. Cancer Res. 18: 3022–3029. - PubMed

Publication types

MeSH terms

Substances