. 2016 Feb 11:10:16.
doi: 10.1186/s12918-016-0260-9.

Integrative modeling of multi-omics data to identify cancer drivers and infer patient-specific gene activity

Affiliations

Integrative modeling of multi-omics data to identify cancer drivers and infer patient-specific gene activity

Ana B Pavel et al. BMC Syst Biol. .

Abstract

Background: High throughput technologies have been used to profile genes in multiple different dimensions, such as genetic variation, copy number, gene and protein expression, epigenetics, metabolomics. Computational analyses often treat these different data types as independent, leading to an explosion in the number of features making studies under-powered and more importantly do not provide a comprehensive view of the gene's state. We sought to infer gene activity by integrating different dimensions using biological knowledge of oncogenes and tumor suppressors.

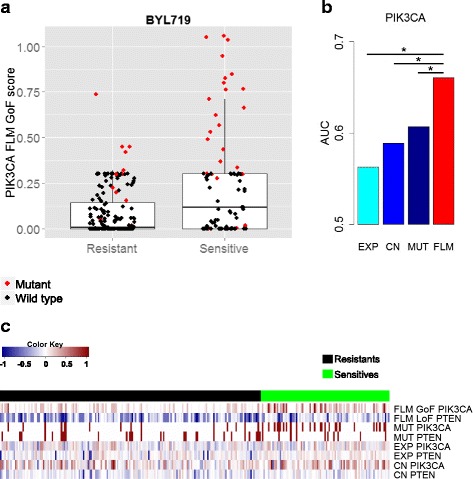
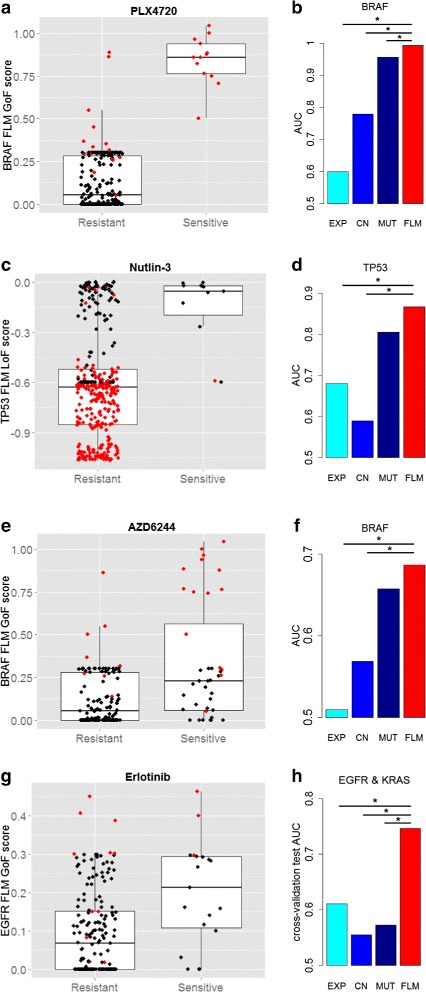
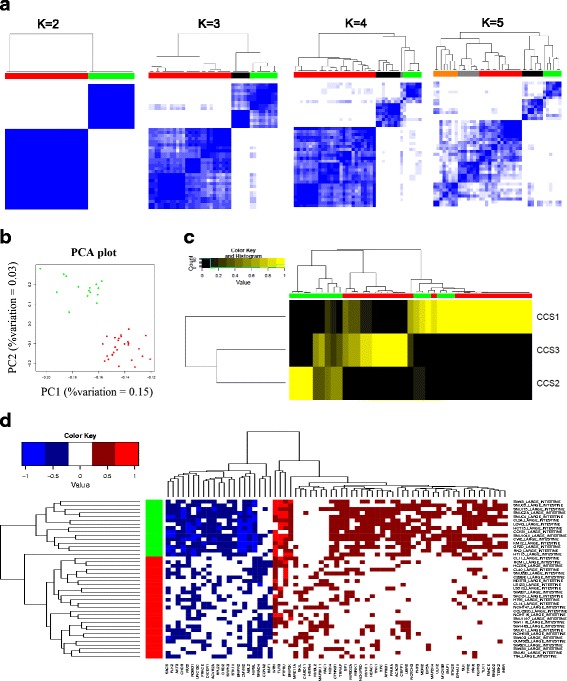
Results: This paper proposes an integrative model of oncogene and tumor suppressor activity in cells which is used to identify cancer drivers and compute patient-specific gene activity scores. We have developed a Fuzzy Logic Modeling (FLM) framework to incorporate biological knowledge with multi-omics data such as somatic mutation, gene expression and copy number measurements. The advantage of using a fuzzy logic approach is to abstract meaningful biological rules from low-level numerical data. Biological knowledge is often qualitative, thus combining it with quantitative numerical measurements may leverage new biological insights about a gene's state. We show that the oncogenic and altered tumor suppressing state of a gene can be better characterized by integrating different molecular measurements with biological knowledge than by each data type alone. We validate the gene activity score using data from the Cancer Cell Line Encyclopedia and drug sensitivity data for five compounds: BYL719 (PIK3CA inhibitor), PLX4720 (BRAF inhibitor), AZD6244 (MEK inhibitor), Erlotinib (EGFR inhibitor), and Nutlin-3 (MDM2 inhibitor). The integrative score improves prediction of drug sensitivity for the known drug targets of these compounds compared to each data type alone. The gene activity scores are also used to cluster colorectal cancer cell lines. Two subtypes of CRCs were found and potential cancer drivers and therapeutic targets for each of the subtypes were identified.

Conclusions: We propose a fuzzy logic based approach to infer gene activity in cancer by integrating numerical data with descriptive biological knowledge. We compute general patient-specific gene-level scores useful to determine the oncogenic or tumor suppressor status of cancer gene drivers and to cluster or classify patients.


Figures

Fig. 1
Fig. 1
Inferring gene activity by integrating different data types and biological knowledge. a Example showing how mutation, copy number and expression data are important for inferring the activity of PIK3CA (oncogene), and PTEN (tumor suppressor). b Schematic for Fuzzy Logic Modeling (FLM)
Fig. 2
Fig. 2
Gene activity scores and inferred GoF/LoF status using Fuzzy Logic Modeling. a Distribution of GoF and LoF activity scores across all genes and all samples. b For each gene that presents mutations in CCLE (more than 1 % of the samples), two scores are computed (GoF and LoF gene score). GoF gene score is computed as the percentage of mutated samples with G o F>|L O F|. LoF gene score is computed as the percentage of mutated samples with |L o F|>G o F. A gene is classified as GoF (oncogene) if the GoF gene score is >50 % or as LoF (tumor suppressor) if the LoF gene score is >50 %. c Known oncogenes [3] were correctly predicted by our method with an accuracy of 90 % (19/21). d Known oncogenes [3] were correctly predicted by our method with an accuracy of 86 % (18/21). Note that the known oncogenes and tumor suppressors were restricted to those that were found to be mutated in the CCLE at >1 % frequency
Fig. 3
Fig. 3
FLM gene activity scores improve prediction of BYL719 drug sensitivity compared to using expression, mutation and copy number data separately. a Boxplot for PIK3CA FLM scores vs. BYL719 (PIK3CA inhibitor) sensitivity. BYL719 sensitive group has higher activity scores compared to the resistant group (t-test p <10−4). Even within the PIK3CA missense mutants (colored in red), we see that FLM GoF scores are higher in sensitive compared to resistant group (t-test p <0.0008). b Using PIK3CA FLM GoF scores to predict sensitivity, the AUC significantly improved compared to expression, mutation and copy number data separately, p<0.05. We denote by * the significance level of 0.05. c Heatmap showing the FLM activity scores for PIK3CA, PTEN and the individual data types. All values are scaled between [–1, 1]. Note that our algorithm correctly labeled PIK3CA as a GoF gene, and PTEN as a LoF gene, consistent with their classification in the literature. The color bar on top indicates the sensitivity groups for the samples (green = sensitive, black = resistant). The combined predictor of PIK3CA GoF scores and PTEN LoF scores significantly improves performance compared to combinations of individual data types, p<0.009
Fig. 4
Fig. 4
FLM gene activity scores differentiate the sensitive vs. resistant groups better than the relevant mutations (colored red) in each compound: a PLX4720, c Nutlin-3, e AZD6244, g Erlotinib. FLM scores improve prediction of drug sensitivity compared to gene expression, somatic mutation and copy number data separately: b PLX4720, p<0.00002, d Nutlin-3, p<0.06, f AZD6244, p<0.22, h Erlotinib using EGFR-KRAS predictor, p<0.01. We denote by * the significance level of 0.05
Fig. 5
Fig. 5
Identifying unsupervized clusters in colorectal cancer and finding differential gene activity within each cluster. a Consensus matrix for K=2,3,4,5, using k-means clustering on colorectal cell lines. The consensus matrices show that there are two distinct subtypes which are stable even when K is increased. b Principal component analysis (PCA) plot of the FLM gene activity scores for 42 colorectal cancer cell lines. Colors indicate the two subtypes found using consensus clustering. c Subtypes found by FLM in CCLE are validated by comparing with subtypes in TCGA [36]. CCS2 is correlated with cluster 2 (green), while cluster 1 is split between CCS1 and CCS3. d Heatmap of the significantly differential gene activity scores (Student’s t-test, F D R<0.05) which differentiate the two FLM subtypes

References

    1. The Cancer Genome Atlas Research Network and others Comprehensive molecular portraits of human breast tumours. Nature. 2012;490(7418):61–70. doi: 10.1038/nature11412. - DOI - PMC - PubMed
    1. Johnstone IM, Titterington DM. Statistical challenges of high-dimensional data. Philos Trans R Soc Lond A Math Phys Eng Sci. 2009;367(1906):4237–253. doi: 10.1098/rsta.2009.0159. - DOI - PMC - PubMed
    1. Vogelstein B, Papadopoulos N, Velculescu VE, Zhou S, Diaz LA, Kinzler KW. Cancer genome landscapes. Science. 2013;339(6127):1546–58. doi: 10.1126/science.1235122. - DOI - PMC - PubMed
    1. Weinstein JN, Collisson EA, Mills GB, Shaw KRM, Ozenberger BA, Ellrott K, et al. The cancer genome atlas pan-cancer analysis project. Nat Genet. 2013;45(10):1113–20. doi: 10.1038/ng.2764. - DOI - PMC - PubMed
    1. Hudson TJ, Anderson W, Aretz A, Barker AD, Bell C, Bernabé RR, et al. International network of cancer genome projects. Nature. 2010;464(7291):993–8. doi: 10.1038/nature08987. - DOI - PMC - PubMed

Publication types

Substances

LinkOut - more resources