. 2016 Feb 11:6:20880.
doi: 10.1038/srep20880.

Mapping forests in monsoon Asia with ALOS PALSAR 50-m mosaic images and MODIS imagery in 2010

Affiliations

Mapping forests in monsoon Asia with ALOS PALSAR 50-m mosaic images and MODIS imagery in 2010

Yuanwei Qin et al. Sci Rep. .

Abstract

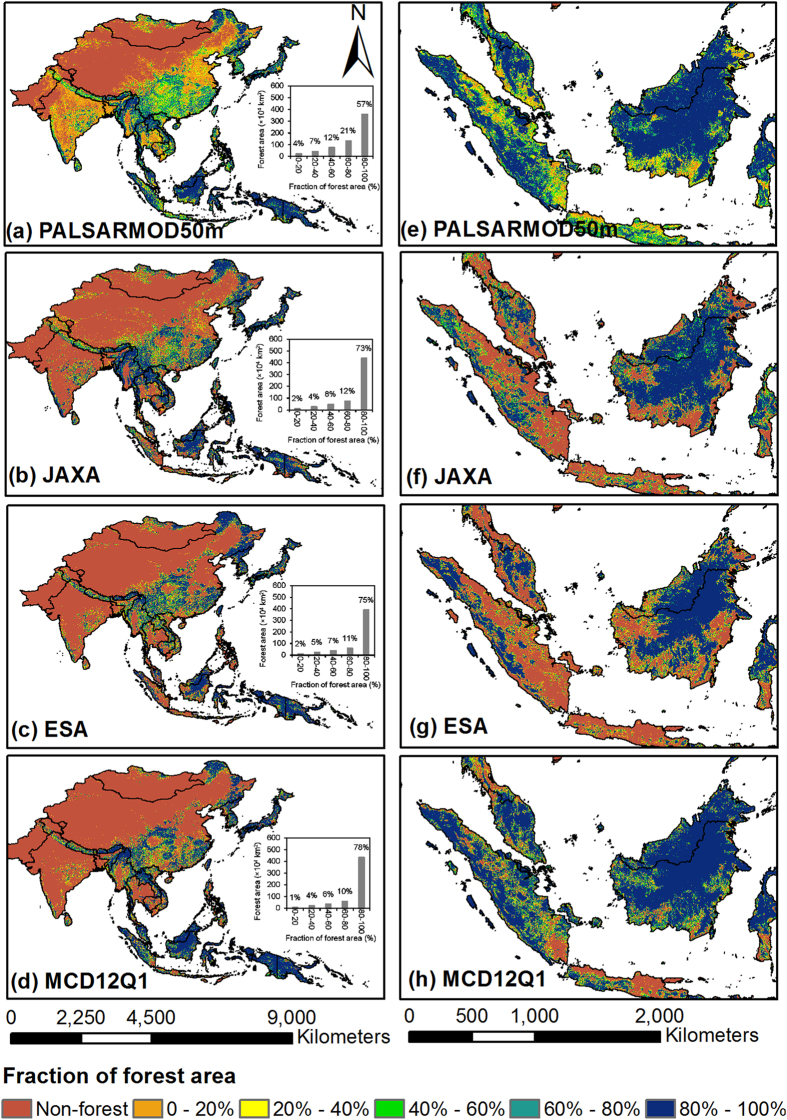
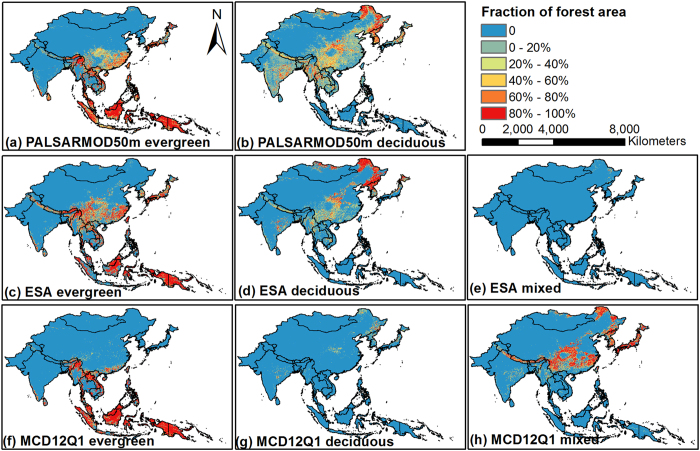
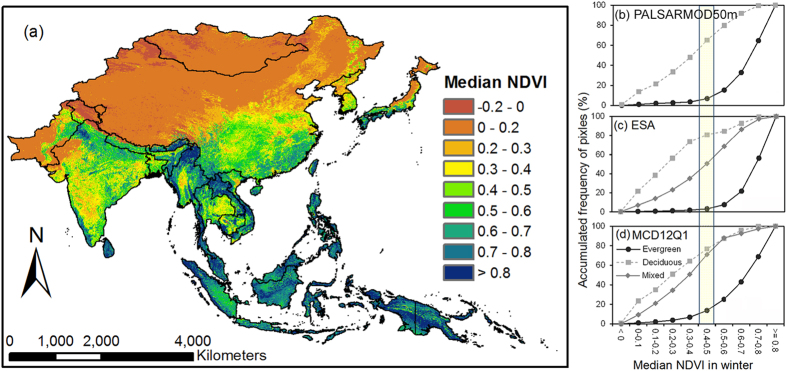
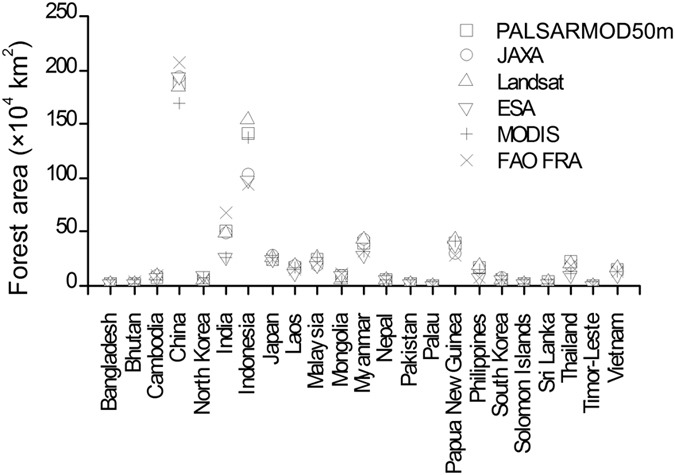
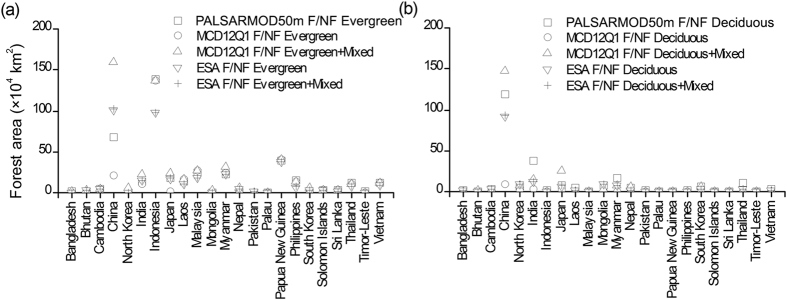
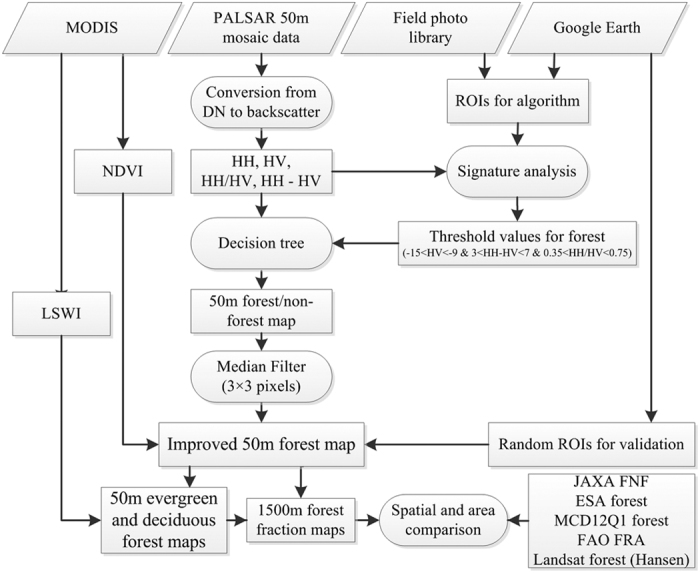
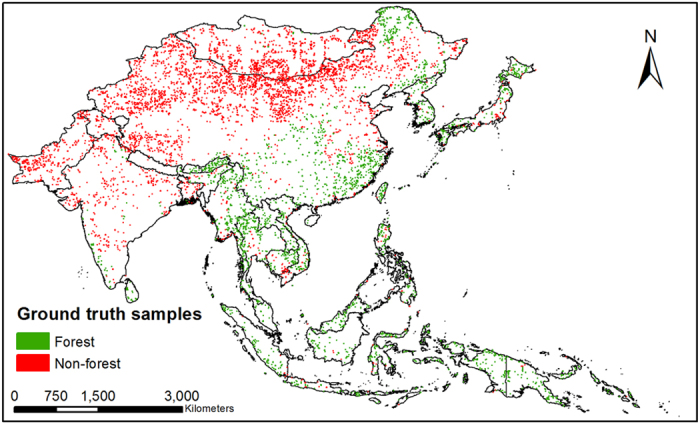
Extensive forest changes have occurred in monsoon Asia, substantially affecting climate, carbon cycle and biodiversity. Accurate forest cover maps at fine spatial resolutions are required to qualify and quantify these effects. In this study, an algorithm was developed to map forests in 2010, with the use of structure and biomass information from the Advanced Land Observation System (ALOS) Phased Array L-band Synthetic Aperture Radar (PALSAR) mosaic dataset and the phenological information from MODerate Resolution Imaging Spectroradiometer (MOD13Q1 and MOD09A1) products. Our forest map (PALSARMOD50 m F/NF) was assessed through randomly selected ground truth samples from high spatial resolution images and had an overall accuracy of 95%. Total area of forests in monsoon Asia in 2010 was estimated to be ~6.3 × 10(6 )km(2). The distribution of evergreen and deciduous forests agreed reasonably well with the median Normalized Difference Vegetation Index (NDVI) in winter. PALSARMOD50 m F/NF map showed good spatial and areal agreements with selected forest maps generated by the Japan Aerospace Exploration Agency (JAXA F/NF), European Space Agency (ESA F/NF), Boston University (MCD12Q1 F/NF), Food and Agricultural Organization (FAO FRA), and University of Maryland (Landsat forests), but relatively large differences and uncertainties in tropical forests and evergreen and deciduous forests.


Figures

Figure 1
Figure 1. Spatial distribution of forests in monsoon Asia at the spatial resolution of 1,500 m in 2010 from multiple forest/non-forest maps.
(a) PALSARMOD50m forest/non-forest map, produced by the developed algorithm in this study. (b) JAXA forest/non-forest map, provided by the Earth Observation Research Center, JAXA (ftp://ftp.eorc.jaxa.jp/pub/ALOS-2/PALSAR_MSC/50m_MSC). (c) ESA forest/non-forest map, provided by ESA Climate Change Initiative-Land Cover (CCI-LC) project (http://www.esa-landcover-cci.org/?q=node/158). (d) MCD12Q1 forest/non-forest map, derived from MODIS/Terra + Aqua Land Cover Type Yearly L3 Global 500m SIN Grid V051 product, provided by Earth Observing System Data and Information System, National Aeronautics and Space Administration (http://reverb.echo.nasa.gov/reverb). (a–d) were aggregated into 1,500 m for spatial comparison in ArcGIS 10.1. (e–h) Zoomed-in forest/non-forest maps in Southeast Asia from (a–d), respectively. This figure was produced using ArcGIS 10.1.
Figure 2
Figure 2. Spatial distribution of evergreen, deciduous, and mixed forests from PALSARMOD50m, ESA, and MCD12Q1 forest maps at the spatial resolution of 1,500 m in monsoon Asia in 2010.
(a) PALSARMOD50m evergreen forests and (b) PALSARMOD50m deciduous forests, produced by the developed algorithm in this study. (c) ESA evergreen forests, (d) ESA deciduous forests, and (e) ESA mixed forests, provided by ESA CCI-LC project (http://www.esa-landcover-cci.org/?q=node/158). (f) MCD12Q1 evergreen forests, (g) MCD12Q1 deciduous forests, and (h) MCD12Q1 mixed forests, derived from MODIS/Terra + Aqua Land Cover Type Yearly L3 Global 500m SIN Grid V051 product, provided by Earth Observing System Data and Information System, National Aeronautics and Space Administration (http://reverb.echo.nasa.gov/reverb). All these maps were aggregated into 1,500 m for spatial comparison in ArcGIS 10.1. This figure was produced using ArcGIS 10.1.
Figure 3
Figure 3. The median NDVI of forests in winter (December, January, and February) in monsoon Asia from 2000 to 2014.
(a) The distribution map of median NDVI in winter from MOD13Q1 product, at the spatial resolution of 250 m, derived from MODIS/Terra Vegetation Indices 16-Day L3 Global 250m SIN Grid V005 product, downloaded from Earth Observing System Data and Information System, National Aeronautics and Space Administration (http://reverb.echo.nasa.gov/reverb). (bd) are the median NDVI distribution of PALSARMOD50m, ESA, and MODIS forests, respectively. This figure was produced using ArcGIS 10.1.
Figure 4
Figure 4. Forest area comparison from multiple forest datasets at the country scale in monsoon Asia in 2010.
This figure was produced using Origin 8.0.
Figure 5
Figure 5
Area comparisons of (a) evergreen and (b) deciduous forests from multiple forest datasets at the country scale in monsoon Asia in 2010. This figure was produced using Origin 8.0.
Figure 6
Figure 6. Workflow of forest mapping in monsoon Asia using 50-m PALSAR, 250-m MOD13Q1 NDVI, and 500-m LSWI derived from the MOD09A1 product.
This figure was produced using Microsoft Visio 2010.
Figure 7
Figure 7. Ground truth samples for the accuracy assessment of PALSARMOD50m forest/non forest map, generated by a random sampling method in IDL 8.4.
This figure was produced using ArcGIS 10.1.

Similar articles

Cited by

References

    1. Foley J. A. et al.. Global consequences of land use. Science 309, 570–574, doi: 10.1126/science.1111772 (2005). - DOI - PubMed
    1. Bonan G. B. Forests and climate change: Forcings, feedbacks, and the climate benefits of forests. Science 320, 1444–1449, doi: 10.1126/science.1155121 (2008). - DOI - PubMed
    1. van der Werf G. R. et al.. CO2 emissions from forest loss. Nat Geosci 2, 737–738, doi: 10.1038/ngeo671 (2009). - DOI
    1. IPCC. Climate Change 2007: The Physical Science Basis. Contribution of Working Group I to the Fourth Assessment Report of the Intergovernmental Panel on Climate Change [ Solomon S., Qin D., Manning M., Chen Z., Marquis M., Averyt K. B., Tignor M. & Miller H. L. (eds)]. (Cambridge University Press, Cambridge, United Kingdom and New York, NY, USA, 996 pp., 2007).
    1. DeFries R. et al.. Earth observations for estimating greenhouse gas emissions from deforestation in developing countries. Environ Sci Policy 10, 385–394, doi: 10.1016/j.envsci.2007.01.010 (2007). - DOI

Publication types